
You are here...


 The fact that the DataGroup interview methodology is so automated means that the cost per question or per survey is much lower than that of our competitors; thus we can offer clients very competitive prices for published reports, online products, DVDs, and other information products. There are extensive verification and security checks built into DataGroup survey methodology to ensure accuracy and confidentiality.
DataGroup reports are based on wholly original research. There is little confidence in company accounts, credit reports, government or trade statistics and thus one has to approach the problem of getting corporate intelligence and market data from a number of standpoints.
 DataGroup believe that the only reliable way to analyze and evaluate the market-place is by conducting statistically accurate analyses of the Suppliers, Bankers, Financiers, Service Providers of supplier companies and then the Distribution Channels and End Users of the products and services. Surveys are also necessary for the Competitors of the suppliers, and the overall Industry and Market environment. By correlating the results of these analyses one can provide highly accurate data and analyses of Companies, Competitors, Markets, Products, Marketing, the Industry, Distribution and the Customers.
Methodology

It is very difficult to adequately describe the Methodology used by DataGroup and The Data Institute. The systems and software in use have been for the past 45 years, and even more so today, by far the most advanced in the world and thus DataGroup are at the apex of the application of artificial intelligence and information technology.
The first important aspect to remember about DataGroup databases and reports is that they are entirely computerized - from initial survey interviewing, to the finished database, to the finally report; and this means that DataGroup clients are assured of a uniform standard and quality with all DataGroup products.

The computerization, development of the methodology and the programs and modelling has taken over forty years to perfect; and DataGroup believe that the generation of their databases and reports are the most advanced in the world. No other organisation has such advanced techniques or such thorough methodology.


DATA SOURCES
Data on a target company, its suppliers, internal operations, products, competitors and markets is examined at four levels of commercial activity:-
The Input Level:
An analysis of the Input materials, supplies and services bought or consumed by the target company, the type of goods or services bought, value products bought, quantities purchased, prices paid, scheduling of purchases, et cetera.
The Process Level:
An exploration of the internal processes at the target company which combined the Input products with the procedures that manipulate the inner components (Financial + Capital resources, Management, Labor, Equipment usage, Physical processes, Product production, Premises & Locations, Distribution, Marketing, etcetera) to produce the Output product - whether that be physical products or services.
The Competitor Level:
An investigation into the major competitors of the target company and the company's relative performance, its product offerings, its service, its quality, et cetera, in relation and relative to the other competitors.
The Market Level:
An appraisal of the interaction of the target company with the various market elements and the problems and opportunities for the target company within the markets in which the company operates and within market in which the company may potentially operate in the future.
For example, the market consumption data provided in the databases will be based on three independent sources:-
i. A statistically accurate survey of End Users , i.e. the market.
ii. A statistically accurate survey of the Distribution System.
iii. A survey of all major Competitors, i.e. the industry base.
By gaining information from these levels of market activity one can produce a very accurate picture of the market.
The same thorough methodology prevails throughout the entire study and for this reason the reports are of such a high quality.
EFFICIENT PROCESSING OF DATA
In addition to the national on-line searches and the gathering of other public and private information, the results of survey interviews are entered by the interviewers directly into a terminal and after each interview session the results are directly transferred to one of the main computers.
EXCELLENT FORECASTING MODELS
The databases and subsequent reports are entirely composed by computer using the base data provided by the various surveys and from other sources. The computer's programs construct the report which is then supplied online or output on DVD and it is these originals which are supplied to the client who thereby receives the most up-to-date information.
HIGHLY SOPHISTICATED REPORT GENERATION
The forecasts are produced using an extremely comprehensive range of forecasting models which take the best features from a wide range of forecasting models and blend these into an interactive matrix which ensures a high level of certainty in forecasts produced.
AUTOMATIC UP-DATING
Databases and reports are automatically up-dated by the computer when new surveys are completed or company / market / competitor conditions change; and thus a new forecast is produced. This is done as often as may be necessary (and especially with Consumer, Seasonal or High Technology markets where up-dates are done weekly). The majority of reports need only to be updated monthly.
INPUT FROM CONSULTANTS + SPECIALISTS

SURVEY METHODOLOGY
The only reliable way to analyze and evaluate the market-place is by conducting statistically accurate analyses of the Suppliers, Bankers, Financiers, Service Providers of the target company and then the Distribution Channels and End Users of the company's products and services. Also surveys are necessary for the Competitors of the company and the overall Industry and Market environment. By correlating the results of these analyses one can provide highly accurate data and analyses on the target company, its Competitors, the Markets, the Products, the Marketing, the Industry, the Distribution and the Customers.
END USER SURVEYS
The most important part of the base data collection are the End Users SURVEYS, (i.e. the customers of the target company and the various competitors), as these reveal the true nature of the market-place.
The END USER SURVEYS conducted use the following formula:-
1. SELECTION OF INTERVIEW PANELS. The prospective interviewee panel is selected from lists which are maintained on named respondent in each of the research areas.
2. MAILSHOT / EMAIL / TEXT TO POTENTIAL INTERVIEWEES A letter or email is sent to the potential (Industrial or Commercial) interviewees explaining the nature of the survey and the products and markets the survey wishes to cover. (Industrial & Commercial markets)
3. PILOT SURVEY (5% OF SAMPLE) A Pilot Survey is conducted with 5% of the sample to evaluate and modify the survey and isolate potential response problems.
4. MAIN SURVEY (90% OF SAMPLE) The Main Survey is conducted amongst 90% of the sample using the modified questionnaire.
5. CHECK SURVEY (5% OF SAMPLE) A Check Survey is conducted with the remaining 5% of the sample to check outstanding points and verify any problem areas.
6. CONSUMER / END USER PERSONAL SURVEYS Where telephone surveys are not appropriate, personal or face-to-face surveys are conducted with respondents.
SAMPLE STRUCTURE
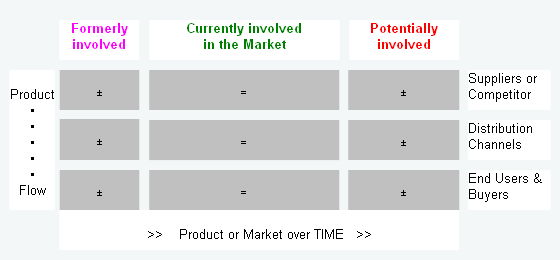
It is a standard technique of the surveys of End Users , the Distribution Channels and Suppliers to interview three levels of respondents:-
1. the majority of the sample is taken from respondents CURRENTLY involved with the company and/or the product,
2. a sample is taken of respondents FORMERLY involved with the company and/or the product, and
3. a sample is taken from respondents who are POTENTIALLY likely to be involved with the product or company in the future.
This method gives a very accurate picture of the development of the product and market over a period of time.
Thus it is possible to evaluate and analyse the reasons:-
i. why respondents currently supply, distribute or consume the products
ii. why respondents have ceased (for reasons of technical or technological developments, product obsolescence or substitution, et cetera) to be involved with the product, and
iii. lastly why respondents are planning to become involved in the product (for reasons of new product development, new production facilities, acquisition, diversification, et cetera).
TOTAL SURVEY SAMPLE
The samples of the Distribution Channels and End Users are composed of a stratified random sample. The stratification of the sample reflects analysis and modelling of frequency variables (e.g. level & value of product flow), sample dispersion (e.g. type of respondents in the universe), distribution skewness, product correlations, regression, probability and significance, time projection and trends.
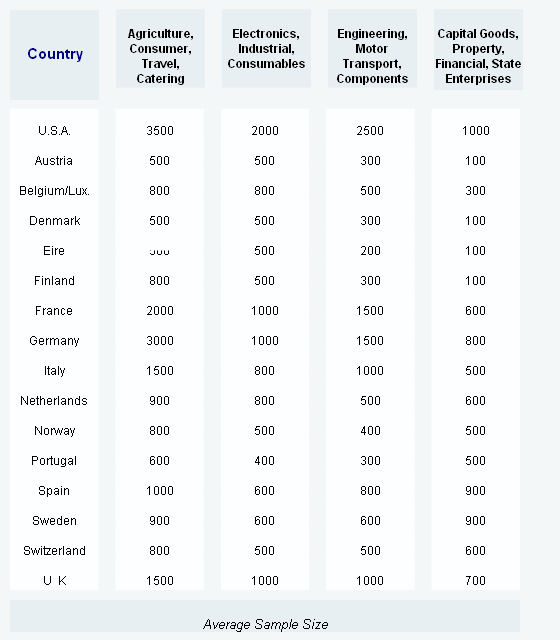
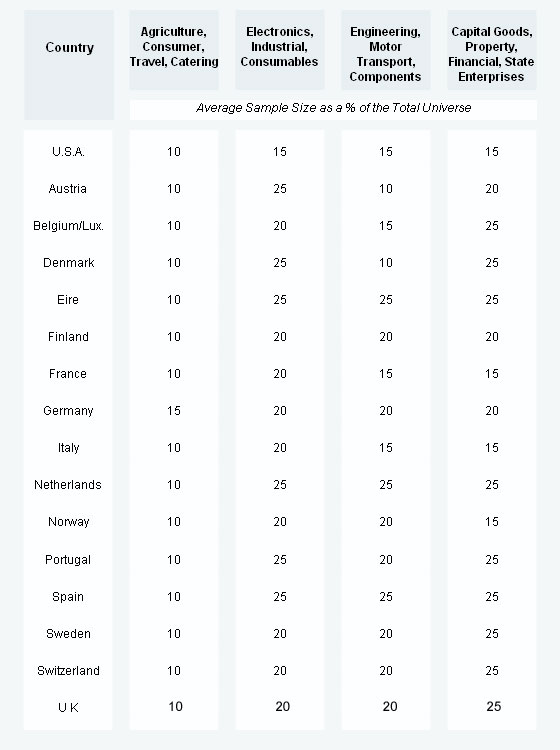
SAMPLE SIZES
There are guarantees minimum VALID sample size for each of the databases. Sample sizes vary from market to market, however the following examples show the parameters that apply:-
INTERVIEWING METHOD:
Sampling is carried out by personal and/or telephone interview. In addition online surveys are conducted with panels and groups.
The exact interviewing method used depends on the complexity of the product or market as well as the depth of information sought.
SURVEY ANALYSIS:
Personal interviews are recorded on tablets which are then transferred to, and processed by, the programming algorithms. Telephone interviews are conducted by interviewers who place the information received directly into a computer or intelligent terminal. The data is then transferred directly to the main computers for batch processing.
DISTRIBUTION CHANNEL SURVEYS:
The Distribution Channel Surveys use the same methodology, Interview Method and Survey Analysis as do the End User Surveys.
SAMPLE SIZE: Sample sizes for the Distribution Channel Surveys are based on a percentage of the total number of companies distributing the product/s concerned. The percentage interviewed depends on the industry in question and the complexity of the product. In general however the above average sample size are used.
SUPPLIERS SURVEYS:
The Surveys of Suppliers and Service Providers use the same methodology as the surveys above.
SUPPLIER SAMPLES:
The sample of Suppliers represents at least 70 to 75% of the total universe. The surveys of Suppliers yields confirmation of supplier output to the target company, product information, financial data and future plans. Suppliers are regarded as being a reliable source of information on the target company as they tend to be keen to discuss their selling prowess, are informed about the procurement of the company and are knowledgeable about the products purchased by the target company and thus their internal processes.
COMPETITOR SURVEYS:
The Surveys of Competitors the same methodology as the surveys above.
COMPETITOR SAMPLES:
The sample of Competitors represents at least 70 to 75% of the total universe. The surveys of Competitors yields verification of product output & specifications, financial data and future product and market plans. Competitors are considered a reasonable source of information on markets as they are inclined to promote their future plans, marketing activities and product performance as well as their expertise in market and competitive conditions.
TELEPHONE SURVEY METHODOLOGY
EXAMPLE:
If an interviewer is surveying a truck operator then the computer will format the questionnaire according to the makes and models of trucks operated by the respondent. The computer also imposes range checks and input screening according to particular makes and type of trucks; therefore, if the interviewer asks questions about the engine life or gearbox life the computer will only accept answers within certain ranges. These ranges will be based on the known average life of engines or gearboxes of particular truck makes. The computer monitors answers and will amend the known standard deviation of response ranges. As answers change (due to technological or product development, changes in buying patterns, et cetera) the ranges and input screens are automatically amended.
The local interviewers receive the survey questionnaires and the names and telephone numbers of the survey respondents for each survey session.
The interviewers use their computers when interviewing. The questionnaires are displayed on screen and the interviewers asks the questions which appear and type in the respondent's answers.
The computer firstly displays the respondent's name and telephone number. A percentage of the telephone numbers displayed are "check" numbers and the interviewers have to identify these; this assures that all the interviews are being conducted; and this therefore guarantees the integrity of the survey.
The questionnaire displayed on the screen is interactive and intelligent and will not allow the interviewer to input answers which do not comply to certain range checks, input screening, and correlation with preceding answers.
The interviewer's computer also :-
1. Monitors the number of interviews done for each questionnaire and thereby ensures that the correct sample size is achieved.
2. Records spoiled questionnaires which have been rejected because of insufficient data received or incorrect input ranges. These are then analyzed to establish why answers did not correspond to the range checks.
3. Records changes of contact names or job functions.
4. Monitors and ensures that the required number of "check" respondents have been identified and thereby ensures the integrity of the sample.
5. Provides notes and explanations for interviewers and respondents which facilitate the understanding of the questions asked.
In this way relatively non-technical interviewers can be used to survey technical and specialist products and markets without the risk of the accuracy of the input data being compromised.


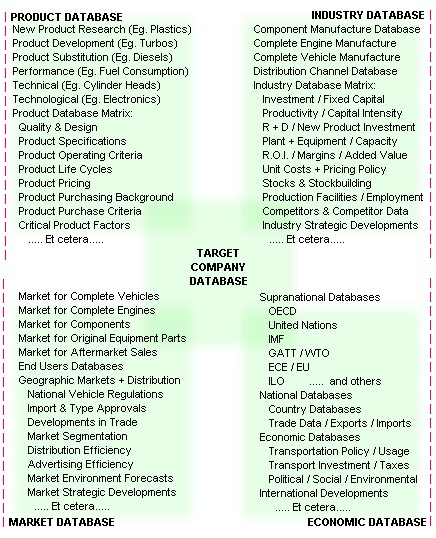
DATABASE MATRIX AND INTERACTIONS
FOR EXAMPLE,
If one were to forecast revenue and sales for a target company which produces VEHICLE ENGINES & COMPONENTS, the database matrix and interaction would probably be as shown:
The same database management methodology is used to produce all corporate databases and their concomitant reports.
It is necessary when forecasting corporate, product and market trends to use a matrix of related databases in order to evaluate and analyze the movement of products and markets due to supply and demand, product and market forces, product life cycles, product obsolescence and substitution, new product developments, technical and technological innovations, market saturation, new markets, market and product segmentation, et cetera.
THE FORECAST/ PLANNING MODELS
In order to accurately analyze and project the above areas, a battery of forecasting models are used.
These models are interactive and simultaneous and draw from a common database which is designed to be critical to the report concerned.
This database management methodology ensures that databases and reports are extremely accurate as they use the most discrete and detailed company operation, product and market sector as the foundation, and then, builds up the database step by step.
The success of a Forecast/Planning model, for periods in excess of two years, depends on the ability of that model to analyze and evaluate a series of interrelated levels of corporate, economic and commercial activity. Each level tends to be equally critical to the forecasting method and thus accuracy must be maintained at all levels. The Forecast/Planning Model used are complied from a number of programs and seeks to interact the various levels of corporate / economic / commercial activity, not only through a series of forecasting routines, but also via a number of refining procedures: the distillate of which represents the Forecast.
The complexity of the market / product / company and the desired accuracy of the prediction dictates how many of the battery models are used. The more complicated the product, market or company the greater the need for accuracy and thus more battery models are used.
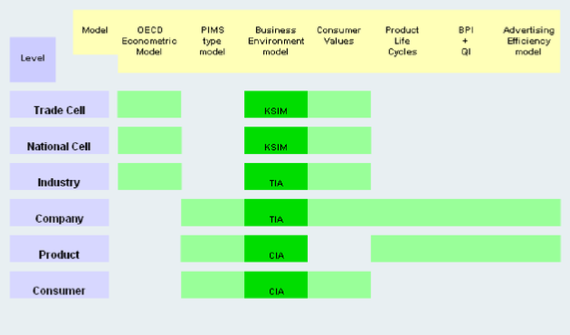
The levels of economic / commercial activity are as follows:
1. The Trade Cell (e.g. The EU or NAFTA or OECD countries)
2. The National Cell (e.g. The United States)
3. The Industry
4. The Suppliers
5. The Company
6. The Product
7. The Competitors
8. The Consumer
I. OECD ECONOMETRIC MODEL:
The model program used is the standard OECD Econometric program which has been developed by the OECD Department of Economics and Statistics in Paris. The programming utilizes a number of databases, which when first established in the 1970s included the following:
a) The International Financial Statistics supplied by the I M F in Washington. These are: IMF.1/FMB, IMF.2/FGNSTAT, IMF.3/FNDACCT, IMF.5/FOOTMST, IMF.6/FBOPMST, IMF.7 - et cetera.
b) OECD databases on wages & prices developments, consumption, investment, trade, et cetera.
c) In addition the following databases are also available for specific applications: UNSO.1, UNSO.2/NAMAST, UNSO.3/ICPDATA, UNSO.4/WORLDENERGY, UNSO.5/STAPC, UNSO.6, UNSO.7/UNIDUST, ECE.11059A, ECA Series, ILO.1, FAO.1, GATT.1/TTDF - et cetera.
d) National governmental databases, including Customs' databases, Sales Tax / Value Added Tax databases, Internal Revenue Tax databases, Social Security databases, Judicial databases, et cetera.
Since that time the number and scope of the multinational econometric databases used has expanded enormously.
II. PIMS TYPE MODEL: PIMS
uses an industry critical Multiple Regressional Analysis program which identifies those variables affecting industries, companies / products, their market share and profitability.
III. BUSINESS ENVIRONMENT FORECAST MODELS:
Three models are used to forecast business environment and these are specific to certain levels of economic / commercial activity:
Cross Impact Simulation (KSIM): This is a program for interactive variables and is used to forecast business environments in an international and national context and provides a representation of changes in a system of variables over time; especially trends, events and structural relationships. The program is widely used in the U S and users of the U S Army, U S Navy, NASA, National Science Foundation and many multinational companies.
Trends Impact Analysis (TIA): TIA is used for problems involving changes in trends at Industry and Company level and produces a representation of changes in trend/s and event/s. A further representation of probabilities is also produced. The program is widely used by U S multinational companies.
Cross Impact Analysis (CIA): This is a program designed for use in solving project level problems, including new product developments, and deals with a representation of cumulative probabilities of an event over time. The model investigates events, structural relationships and probabilities and is successfully used by many U S multinational companies.
IV. CONSUMER VALUES MODEL:
The use of Consumer Values models have two purposes. Firstly because it extends and correlates market behaviour beyond such external forces as Disposable Income or Demographics and secondly, it enhances the predictability of market Behaviour by providing insight into why consumers act as they do. There are trend projections for 14 years for all Consumer Values; some 34 to 40 major cells. These values affect consumer spending on definable items and markets. In the case of Capital Equipment one additional value is used, namely, the monthly Business Confidence Monitor, which seeks to quantify purchasing trends amongst buyers.
V. PRODUCT LIFE CYCLE MODEL:
The Product Life Cycle Model uses the normal innovation / diffusion Gompertz Function with the added advantage of a matrix of industry critical correlation.
VI. BPI & QI MODELS:
It is essential to effectively measure the relative buying power of various market segments and geographic markets; this is done with a Buying Power Index and a Quality Index. BPI is also useful for determining how effectively a company uses its marketing effort. QI is used to analyze the ability of a market sector or geographic market to purchase unessential goods with a high discretionary index.
Additionally, a number of other programs may have to be used, including:
i. Market Saturation Index;
ii. Inventory costs;
iii. Recorder points (Trade);
iv. MNR:MC ratios
VII. ADVERTISING EFFICIENCY MODELS:
These models evaluate the effect of revenue / advertising relationships over time and are designed to investigate those functions of advertising efficiency which affect revenue and to provide predictions on the actions of those factors over time.
The main functions of the model are:
1. The Sales Decay Constant, which measures advertising effect over time.
2. The Market Saturation Level, which investigates the effectiveness of the media mix and the asymptotic values of the media expenditure.
3. The Sales Response Constant, which gives the ratio between revenue and advertising.
The above models provide the Coefficient of Advertising Efficiency at a given revenue / advertising expenditure function.

| Account Holders |
| Clients |
| Compatibility |
| FAQ |
| Methodology |
| Orders |
| Our Brands |
| Questions |
| Quotations |
| Terms |
| PureData |
| Chemical & Pharma |
| PureData Express |
| PureData World |
| PureData Regions |
| PD Country & Town |
| PureData Country |
| PureData PDF |
| PureData Database |
| Chemical Databases |
| Pharma Databases |
| Get Brochure |
| Base Corporate Data |
| Tactical & Strategic |
| Acquisitions |
| Get Brochure |
| Companies List |
| TS Companies |
| ACQ Companies |
| Market |
| Companies |
| Product |
| Process |
| Distribution |
| Technology |
| World Geographic |
| B2B Buyer Index |
| Markets & Companies |
| NIN Global |
| World Consumption |
| Market Surveys |
| B2B Purchasing |
| B2B Databases |
| B2B Targets |
| B2B Reports List |
| B2B About |
| B2B Buying PDF |
| Summary Reports |
| World Databases |
| Regional Databases |
| Country & Town |
| Country Databases |
| Market Data CD |
| MCW PDF |
| NIN Express |
| NIN Databases |
| Global Data |
| Regional Data |
| National + City |
| National Data |
| National Intelligence |
| National & Local |
| Local Intelligence |
| NIN About |
| NIN - PDF |
| World Product |
| Product Surveys |
| NAICS List |
| World Process |
| Process Surveys |
| Process Inputs |
| World Distribution |
| Distribution Surveys |
| Technology Surveys |
| Countries |
| Cities & Towns |
| Geographic Areas |
| World Industries |
| World Logistics |
| World Marketing |
| World Consumers |
| Account Holders |
| Clients |
| Compatibility |
| FAQ |
| Methodology |
| Orders |
| Our Brands |
| Questions |
| Quotations |
| Terms |
| Ancillary Services |
| After-Sales Support |
| Bespoke Databases |
| Business Resource |
| Consultants |
| Data Mining |
| Image Surveys |
| Online |
| Reference |
| Research Webs |
| Resource Webs |
| Seminars |
| Service Team |
| Support |