|
The very Best
Information Methodology
in the World |
|
Methodology
|
|
 |
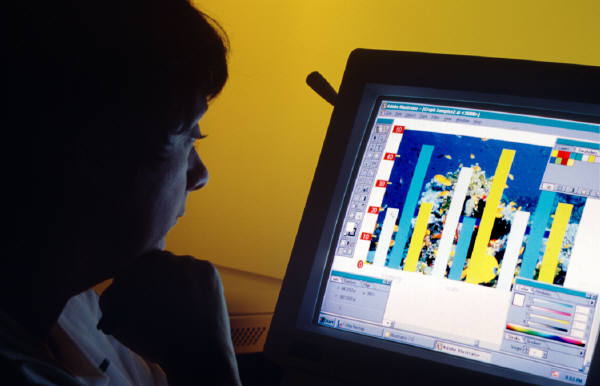
METHODOLOGY
|
| |
|
The Bottom Line: How accurate is the information? Any database provider
who makes any certainty or accuracy claims for their information product is misleading
their clients. Essentially, in a world of Chaos Theory, irrational politicians and
currency speculators there is no credible information supplier that can guarantee any
aspect of the information provided. For example it is well know that the U.S. Government
frequently misreport trade statistics in order to influence GATT negotiations; the British
Government have for at least 20 years been cooking the books on the unemployment figures
and have reported figures which bear no relationship to the truth; and a similar
fabrication of economic statistics can be found with almost every government in the world.
Lies, Damn Lies and Statistics: How can one get good information? The only
certain way to get good information is to use good methodology. The truth is that
MarketCD
and CompanyCD
Titles are produced to a certain price and given the margins available the best possible
methodology is used to produce the product. To find out if this product is better or worse
than competitor information products you need to compare the methodology of the
competitors. The best methodology will produce the best information. That is the bottom
line.
It is very difficult in a limited discussion like this to adequately describe the
Methodology used in the production of MarketCD
and CompanyCD
Titles.
The systems and software used for this product have been for the past 25 years, and even
more so today, by far the most advanced in the world and thus
MarketCD
and CompanyCD
are at the apex of the application of artificial intelligence, forecasting and computer
technology.
The first important aspect to remember about MarketCD
and CompanyCD
is that they are
entirely computerised - from initial survey interviewing to the final print of the CD-Rom
and this means that clients are assured of a uniform standard and quality with all Titles.
The computerisation, development of the methodology and the programs took over 20 years
and we believe that the generation of the databases and MarketCD
and CompanyCD
Titles
are the most advanced in the world. No other company has such advanced techniques or such
thorough methodology.
The fact that the interview methodology is so automated means that the units costs per
question or per survey are much lower than that of other researchers, thus one can offer
clients very competitive prices for both databases and CD-Roms. There are extensive
security checks built into survey methodology to ensure accuracy and confidentiality.
|
|
| |
ORIGINAL RESEARCH
MarketCD
and CompanyCD
are based on wholly original research. There is little confidence in
company accounts, credit reports, government or trade statistics and thus one has to
approach the problem of getting corporate intelligence and market data from a number of
standpoints.
DATA SOURCES
Data on an individual company level, its suppliers, internal operations,
products, competitors and markets was examined at four levels of commercial activity:-
The Input Level: An analysis of the Input materials, supplies and services bought
or consumed by companies, the type of goods or services bought, value of products bought,
quantities, prices paid, scheduling of purchases, et cetera.
The Process Level: An exploration of the internal processes at companies which combined
the Input products with the procedures that manipulate the inner components
(Financial + Capital resources, Management, Labour, Equipment usage, Physical processes,
Product production, Premises & Locations, Distribution, Marketing, et cetera) to
produce the Output product - whether that be physical products or services.
The Competitor Level: An investigation into the major competitors of individual companies
and the company's relative performance, its product offerings, its service, its quality,
et cetera, in relation and relative to the other competitors.
The Market Level: An appraisal of the interaction of the company with the various market
elements and the problems and opportunities for that company within the markets in which
the company operates and within markets in which the company may potentially operate in
the future.
For example, the market consumption data provided in the databases will be based on
three independent sources:-
i. A statistically accurate survey of End Users, i.e. the market.
ii. A statistically accurate survey of the Distribution System.
iii. A survey of all major Competitors, i.e. the industry base.
By gaining information from these levels of market activity one can produce a very
accurate picture of the market.
The same thorough methodology prevails throughout the entire study and this is the reason
why these products are reputedly of such a high quality.
|
|
|


.JPG)


.JPG)
.JPG)

.JPG)

.JPG)

 |
|
|


 |
SURVEY METHODOLOGY
The only reliable way to analyse and evaluate the market-place is by
conducting statistically accurate analyses of the Suppliers, Bankers, Financiers, Service
Providers to the company and then the Distribution Channels and End Users of the company's
products and services. Also surveys are necessary for the Competitors of the company and
the overall Industry and Market environment. By correlating the results of these analyses
one can provide highly accurate data and analyses on the company, its Competitors, the
Markets, the Products, the Marketing, the Industry, the Distribution and the Customers.
END USER SURVEYS
The most important part of the base data collection are the END USERS SURVEYS, (i.e.
the customers of the company and the various competitors), as these reveal the true nature
of the market-place.
The END USER SURVEYS conducted use the following formula:
1. SELECTION OF INTERVIEW PANELS
2. MAILING TO POTENTIAL INTERVIEWEES (Industrial & Commercial markets only)
3. PILOT SURVEY (5% OF SAMPLE)
4. MAIN SURVEY (90% OF SAMPLE)
5. CHECK SURVEY (5% OF SAMPLE)
6. CONSUMER / END USER PERSONAL SURVEYS
|
1. The prospective interviewee panel is selected from lists which are maintained by named
respondent in each of the research areas.
2. A mailing is sent to the potential (Industrial or Commercial) interviewees to define
and refine the nature of the survey (and the products and markets one wishes to cover) and
to determine if the respondents are likely to provide a valid sample.
3. A Pilot Survey is conducted with 5% of the sample to evaluate and modify the survey and
isolate potential response problems.
4. The Main Survey is conducted amongst 90% of the sample using the modified
questionnaire.
5. A Check Survey is conducted with the remaining 5% of the sample to check outstanding
points and verify any problem areas.
6. Where telephone surveys are not appropriate, personal or face-to-face surveys are
conducted with respondents.
|


|
|
|
| |
SAMPLE STRUCTURE
It is a standard technique of the surveys of End Users, the Distribution Channels and
Suppliers to interview three levels of respondents:-
1. the majority of the sample is taken from respondents CURRENTLY involved with the
company and/or the product,
2. a sample is taken of respondents FORMERLY involved with the company and/or the
product, and
3. a sample is taken from respondents who are POTENTIALLY likely to be involved
with the product or company in the future.
This method gives a very accurate picture of the development of the product and market
over a period of time.
Thus it is possible to evaluate and analyse the reasons:-
i. why respondents currently supply, distribute or consume the products
ii. why respondents have ceased (for reasons of technical or technological developments,
product obsolescence or substitution, et cetera) to be involved with the product, and
iii. lastly why respondents are planning to become involved in the product (for reasons of
new product development, new production facilities, acquisition, diversification, et
cetera).
The samples of the Distribution Channels and End Users are composed of a stratified random
sample. The stratification of the sample reflects analysis and modelling of frequency
variables (e.g. level & value of product flow), sample dispersion (e.g. type of
respondents in the universe), distribution skewness, product correlations, regression,
probability and significance, time projection and trends.
TOTAL SURVEY SAMPLE
| |
Formally
Involved |
CURRENTLY
INVOLVED
 |
Potentially
Involved |
|
|

Product |
5% |
85% |
10% |
Suppliers
or
Competitors |
|
flows |
10% |
85% |
5% |
Distributors
or
Outlets |
|
Down |
10% |
80% |
10% |
End Users
or
Consumers |
| |
 PRODUCT or MARKET over TIME
|
|
SAMPLE SIZES
There is a guaranteed minimum VALID sample size for each of the
databases. Sample sizes vary from market to market, however the following examples show
the parameters that apply:-
|
COUNTRY |
END USER INDUSTRY or MARKET |
| |
Agriculture, Consumer, Travel, Catering |
Electronics, Industrial Consumables |
Engineering, Motor Transport & Equipment |
Capital Goods, Property, Financial, Nationalised Industries, Engineering, Metals |
| |
( Average Sample Size ) |
|
U.S.A. |
3500 |
2000 |
2500 |
1000 |
|
JAPAN |
1500 |
1500 |
1300 |
800 |
|
CHINA |
800 |
1500 |
1000 |
600 |
|
INDIA |
1500 |
1500 |
1000 |
800 |
|
GERMANY |
1500 |
1500 |
1000 |
1000 |
|
FRANCE |
1500 |
1500 |
1000 |
1000 |
|
U.K. |
1500 |
1000 |
1000 |
1000 |
|
ITALY |
1000 |
1000 |
1000 |
700 |
|
RUSSIA |
1500 |
900 |
1000 |
500 |
|
BRAZIL |
900 |
900 |
900 |
500 |
|
CANADA |
1000 |
800 |
800 |
1000 |
|
SOUTH KOREA |
1000 |
1000 |
1000 |
1000 |
|
MEXICO |
1500 |
1000 |
800 |
800 |
|
SPAIN |
1000 |
1000 |
900 |
1000 |
|
INDONESIA |
1000 |
1000 |
800 |
900 |
|
|
| |
|
|


 |
|
SUPPLIERS SURVEYS
The Surveys of Suppliers and Service Providers use the same methodology as the surveys
above.
SUPPLIER SAMPLES
The sample of Suppliers represents at least 70 to 75% of the total universe. The surveys
of Suppliers yields confirmation of supplier output to the companies in the industry,
product information, financial data and future plans. Suppliers are regarded as being a
reliable source of information on companies as they tend to be keen to discuss their
selling prowess, are informed about the procurement of their customers and are
knowledgeable about the products purchased by companies and thus their internal processes.
DISTRIBUTION CHANNEL SURVEYS
The Distribution Channel Surveys use the same methodology, Interview Method and Survey
Analysis as do the End User Surveys.
SAMPLE SIZE
Sample sizes for the Distribution Channel Surveys are based on a percentage of the total
number of companies distributing the product/s concerned. The percentage interviewed
depends on the industry in question and the complexity of the product. In general however
the following average sample size are used:-
|
COUNTRY |
SUPPLIER INDUSTRY or MARKET |
| |
Agriculture, Consumer, Travel, Catering |
Electronics, Industrial Consumables |
Engineering, Motor Transport & Equipment |
Capital Goods, Property, Financial, Nationalised Industries, Engineering, Metals |
| |
Average Sample Size as a % of the Universe |
|
U.S.A. |
10% |
15% |
15% |
15% |
|
JAPAN |
15% |
20% |
15% |
30% |
|
CHINA |
10% |
25% |
10% |
40% |
|
INDIA |
10% |
20% |
15% |
25% |
|
GERMANY |
10% |
20% |
10% |
30% |
|
FRANCE |
10% |
25% |
15% |
35% |
|
U.K. |
20% |
30% |
20% |
35% |
|
ITALY |
15% |
35% |
20% |
35% |
|
RUSSIA |
10% |
20% |
15% |
25% |
|
BRAZIL |
10% |
15% |
15% |
25% |
|
CANADA |
10% |
20% |
20% |
35% |
|
SOUTH KOREA |
15% |
35% |
35% |
20% |
|
MEXICO |
25% |
15% |
15% |
20% |
|
SPAIN |
15% |
15% |
15% |
20% |
|
INDONESIA |
20% |
15% |
15% |
15% |
|
|
 |
|
COMPETITOR SURVEYS
The Surveys of Competitors the same methodology as the surveys above.
   
COMPETITOR SAMPLES
The sample of Competitors represents at least 10 to 75% of the total universe (depending
on the market). The surveys of Competitors yields verification of product output &
specifications, financial data and future product and market plans. Competitors are
considered a reasonable source of information on markets as they are inclined to promote
their future plans, marketing activities and product performance as well as their
expertise in market and competitive conditions.
|
|
|
|
DATA + COMMUNICATIONS NETWORKS
|
|
Source |
Data Input |
Data Process |
Database |
Output |
|
Regressional Survey Sample data profiles + locations.
Contact lists, Respondent allocation criteria, Standard deviation + scatter historic data |
Downloaded to Interviewer terminals |
Computer allocates questionnaires, sample sizes, locations, range checks, input
screening + formats.
Questionnaires transmitted to Interviewer |
Historic Data sets + time series from 1974 |
Questionnaires |
|
Questionnaires:
Surveys of End Users, Distribution Channels & Suppliers |
Batch processed:
Postal, Telephone, Personal Interviews |
Survey Results + Response Input on Interviewer terminals, batch processed &
transmitted to process computer |
Historic Data sets + time series from 1974 |
Raw survey data |
|
Fixed Internal Databases |
Online |
Input to Process computer |
Historic Data sets + time series from 1974 |
Fixed Internal Database results.
Output data specific to Product / Market / Geographic Location |
|
Fixed External Databases |
Online + Scanned hardcopy |
Input to Process computer |
Various time series + data sets |
Fixed External Database results.
Output data specific to Product / Market / Geographic Location |
|
Web Search of External Databases |
Online |
Input to Process computer |
Various time series + data sets |
Web Crawler Database results.
Selected data specific to Product / Market / Geographic Location |
|
Changing Factors, Technical, Technological, New Product & Market Development
Databases |
Online + Scanned hardcopy |
Input to Process computer |
Various time series + data sets |
Changing Factors results.
Result data specific to Product / Market / Geographic Location |
|
Expert + Specialist Editing |
Online Edit |
Online to Process computer |
Modified data sets |
Expert + Specialist Edited results.
Edited data specific to Product / Market / Geographic Location |
|
Online:
Raw survey data }
Fixed Internal Databases }
Fixed External Databases }
Web Crawler Databases }
Changing Factors }
Expert + Specialist results }
|
Process computer correlates Internal & External databases results |
Standardised time series & data sets produced for forecasting purposes |
Output Data Sets |
|
Forecast Battery + Planning Models |
Online:
Output Data Sets |
Output Data Sets applied to Forecasting Battery methodology |
Data Sets as per Title specifications |
CD-Rom Title
|
|
.JPG)
.JPG)
.JPG)
.JPG)
.JPG)
.JPG)
.JPG)

.JPG)
|
TELEPHONE SURVEY METHODOLOGY
The local interviewers receive the survey questionnaires and the names and telephone
numbers of the survey respondents and the questionnaires and contact lists are stored on
computer. The reverse method is used by the interviewers to transmit the survey results to
the process computer at the end of each interview session.
The interviewers use their micro-computers when interviewing. The questionnaires are
displayed on screen and the interviewers asks the questions which appear and type in the
respondent's answers.
The computer firstly displays the respondent's name and telephone number. A percentage of
the telephone numbers displayed are "check" numbers and the interviewers have to
identify these; this assures that all the interviews are being conducted and therefore
guarantees the integrity of the survey.
The questionnaire displayed on the screen is interactive and intelligent and will not
allow the interviewer to input answers which do not comply to certain range checks, input
screening, and correlation with preceding answers.
The interviewers computer also :-
1. Monitors the number of interviews done for each questionnaire and thereby ensures that
the correct sample size is achieved.
2. Records spoiled questionnaires which have been rejected because of insufficient data
received or incorrect input ranges. These are then analysed to establish why answers did
not correspond to the range checks.
3. Records changes of contact names or job functions.
4. Monitors and ensures that the required number of "check" respondents have
been identified and thereby ensures the integrity of the sample.
5. Provides notes and explanations for interviewers and respondents which facilitate the
understanding of the questions asked.
EXAMPLE: If an interviewer is surveying a truck operator then the computer will
format the questionnaire according to the makes and models of trucks operated by the
respondent. The computer also imposes range checks and input screening according to
particular makes and type of trucks; therefore, if the interviewer asks questions about
the engine life or gearbox life the computer will only accept answers within certain
ranges. These ranges will be based on the known average life of engines or gearboxes of
particular truck makes. The computer monitors answers and will amend the known standard
deviation of response ranges. As answers change (due to technological or product
development, changes in buying patterns, et cetera) the ranges and input screens are
automatically amended.
|
|
|
.JPG)
.JPG)

.JPG)
|
TELEPHONE INTERVIEWERS USING AUTOMATED SYSTEMS

EXAMPLE: If an interviewer is surveying electronic components buyers then the
computer will format the questionnaire according to the equipment being manufactured at
the respondent's factory or plant. Therefore, if the respondent's factory is manufacturing
televisions, the respondent will be questioned specifically about components used in
television manufacture. The range checks imposed by the computer will also be critical to
the product quantities manufactured; therefore, the computer will only accept input data
(on passive components, sub assemblies, et cetera) which complies to known parameters.
Thus, for a given number of television sets manufactured, the computer will expect to
input certain numbers of each component or sub-assembly which is critical to both the
products and the quantity manufactured.
|
|


 |
DATABASE STRUCTURE
Databases are composed of individual company and product databases which
are then aggregated to form report databases.
The actual report will be composed of a number of database levels which reflect the
company and their individual products being investigated. Databases are held at a number
of levels and thus editors can choose exactly how detailed the information they require
need be.
EXAMPLE: If one were to analyse a target company mainly producing ACTIVE
ELECTRONIC COMPONENTS the corporate database structure would be as follows:-
|
CORPORATE DATABASE STRUCTURE |
|
ACTIVE ELECTRONIC COMPONENTS: |
|
Capital Providers |
|
Suppliers of Materials |
|
Service Providers |
|
In-House Process |
Product Output |
|
Capital & Funds used by the Company |
|
Supplies & Materials purchased by the Company |
|
Serviced purchased by the Company |
|
In-house Processes & Activities |
Process |
|
Fixed Long Term
Funds, Buildings, Equipment & Vehicles, Fixed Short Term Funds... |
|
|
|
|
|
|
Infrastructure |
|
Process Products
Consumed by the Company |
|
|
|
|
|
|
Silicon, hyperpure + unalloyed, Plastic resins, Precious metals, Gold, Doped
chemicals, Germanium, Magnetic products, Insulated products, Metal powders, Metal
semi-finished products, Electronic sub-components, Production supplies, Manufacturing
plant supplies, Packaging materials, Handling / marketing supplies... |
|
Sub-Contractors, Financial Services, Bank Loans, Debts, Rent & Leases,
Communications, Maintenance Costs, Power & Fuel, Electricity, Other Services
purchased, General Variable Expenses... |
|
|
Input Stocks & Services |
|
|
|
|
Labour & Staff, Handling, Stocks, Other Internal costs/expense... |
Physical
In-House Process
|
| |
|
|
Process Products Produced by the Company
 |
|
Darlingtons
Duals
Field Effect
General Purpose
Germanium
High Frequency
Low Frequency
Low Noise
Power
Photo
Programmable
Quads
Signal
Switching
Unijunction
Hybrid
Customs
By End User
By Application
By Specifications
By Unit Price
By Unit Volume
|
|
Each product is then
aggregated
into Groups:-
Diodes
Indicating
Devices
Rectifiers
Thyristors
Miscellaneous
Discrete
Components
Database
Transistors
|
|
Each Group is then
aggregated
into higher groups:-
Valves & Tubes
ICs
Miscellaneous
Components
Database
Discrete
Semi-Conductors
|
|
Active Electronic Components
|
Physical
Products
Shipped to
Customers |
1. Isolate those Suppliers which are providing the Capital, Input materials and Services
which is used by the target company.
2. Analyse the Processes of the target company which take the Capital Resources, the Input
materials and the Services provided, merge them with the Internal activities of the target
company and thereby Output the product.
3. Review all the competitors of the target company and determine how these competitors
will impinge in market terms.
4. Investigate the Markets, actual and potential, for the target company.
|
|
| |
DATABASE MATRIX AND INTERACTIONS
EXAMPLE: If one were to forecast revenue and sales for a target
company which produces vehicle engines and components, the database matrix and interaction
would probably be as follows:-
|
Vehicle Engine & Components Database Matrix |
|
PRODUCT DATABASES
|
|
INDUSTRY DATABASES |
|
* NEW PRODUCT RESEARCH (Plastics)
* PRODUCT DEVELOPMENT (Turbos)
* PRODUCT SUBSTITUTION (Diesels)
* PERFORMANCE (Fuel Consumption)
* TECHNICAL (Cylinder Heads)
* TECHNOLOGICAL (Electronics)
* PRODUCT DATABASE MATRIX
- QUALITY & DESIGN
- PRODUCT SPECIFICATIONS
- PRODUCT OPERATING CRITERIA
- PRODUCT LIFE CYCLES
- PRODUCT PRICING
- PRODUCT PURCHASE BACKGROUND
- PRODUCT PURCHASE CRITERIA
- CRITICAL PRODUCT FACTORS
Et cetera...
|
TARGET
COMPANY
|
* COMPONENT MANUFACTURE
* COMPLETE ENGINE MANUFACTURE
* COMPLETE VEHICLE MANUFACTURE
* DISTRIBUTION CHANNEL DATABASE
* INDUSTRY DATABASE MATRIX
- INVESTMENT / FIXED CAPITAL
- PRODUCTIVITY/CAPITAL INTENSITY
- R & D / NEW PRODUCT INVESTMENT
- PLANT & EQUIP./ CAPACITY
- ROI / MARGINS / ADDED VALUE
- UNIT COSTS & PRICING POLICY
- STOCKS & STOCKBUILDING
- PRODUCTION FACILITIES
- COMPETITOR DATA
- PLANT + PRODUCTION SITES
Et cetera...
|
|
TARGET
COMPANY |

|
TARGET
COMPANY |
|
* MARKET FOR COMPLETE VEHICLES
* MARKET FOR COMPLETE ENGINES
* MARKET FOR COMPONENTS
* MARKET FOR ORIGINAL EQUIPMENT
* MARKET FOR AFTERMARKET SALES
* END USER DATABASE
* GEOGRAPHIC MARKETS
* NATIONAL VEHICLE REGULATIONS
* IMPORT & TYPE APPROVALS
* DEVELOPMENTS IN TRADE
* MARKET SEGMENTATION
* DISTRIBUTION EFFICIENCY
* ADVERTISING EFFICIENCY
* MARKET ENVIRONMENT FORECASTS
Et cetera...
|
TARGET
COMPANY
|
* SUPRANATIONAL DATABASES
- OECD
- UNITED NATIONS
- IMF
- GATT
- ECE
- ILO ... and others
* NATIONAL DATABASES
- COUNTRY DATABASES
- TRADE DATA / IMPORT / EXPORT
* OTHER ECONOMIC DATABASES
- TRANSPORTATION POLICY/USAGE
- TRANSPORT INVESTMENT
- POLITICAL/SOCIAL/ENVIRONMENT
Et cetera...
|
|
MARKET DATABASES
 |
|
ECONOMIC DATABASES |
The same database management methodology is used to produce all company databases and
their concomitant reports.
This database management methodology ensures that reports are extremely accurate as they
use the most discrete and detailed company operation, product and market sector as the
foundation, and then, builds up the database step by step.
|
|
| |
THE FORECAST + PLANNING MODELS
The success of a Forecast/Planning model, for periods in excess of two
years, depends on the ability of that model to analyse and evaluate a series of
interrelated levels of corporate, economic and commercial activity. Each level tends to be
equally critical to the forecasting method and thus accuracy must be maintained at all
levels. The Forecast/Planning Model used is complied from a number of programs and seeks
to interact the various levels of corporate / economic / commercial activity, not only
through a series of forecasting routines, but also via a number of refining procedures:
the distillate of which represents the Forecast.
The levels of economic / commercial activity are as follows:
1. The Trade Cell (e.g. The EU or NAFTA or OECD countries)
2. The National Cell (e.g. The United States)
3. The Industry
4. The Suppliers
5. The Company
6. The Product
7. The Competitors
8. The Consumer
In order to accurately analyse and project the above areas, a battery of forecasting
models are used.
These models are interactive and simultaneous and draw from a common database which is
designed to be critical to the report concerned.
The complexity of the market / product / company and the desired accuracy of the
prediction dictates how many of the battery models are used. The more complicated the
product, market or company the greater the need for accuracy and thus to ensure this more
battery models are used. The original forecasting models and databases adopted
in the early 1970s, examples shown below, were augmented and developed through
the years.
I. OECD ECONOMETRIC MODEL:
a) The International Financial Statistics supplied by the I M F in Washington. These are:
IMF.1/FMB, IMF.2/FGNSTAT, IMF.3/FNDACCT, IMF.5/FOOTMST, IMF.6/FBOPMST, IMF.7 - et cetera.
b) OECD databases on wages & prices developments, consumption, investment, trade, et
cetera.
c) In addition the following databases are also available for specific applications:
UNSO.1, UNSO.2/NAMAST, UNSO.3/ICPDATA, UNSO.4/WORLDENERGY, UNSO.5/STAPC, UNSO.6,
UNSO.7/UNIDUST, ECE.11059A, ECA Series, ILO.1, FAO.1, GATT.1/TTDF - et cetera.
d) National governmental databases, including Import/Export databases, Sales Tax / Value
Added Tax databases, Internal Revenue Tax databases, Social Security databases, Judicial
databases, et cetera.
II. PIMS TYPE MODEL:
PIMS uses an industry critical Multiple Regressional Analysis program which identifies
those variables affecting industries, companies / products, their market share and
profitability.
III. BUSINESS ENVIRONMENT FORECAST MODELS:
Three models are used to forecast business environment and these are specific to certain
levels of economic / commercial activity:
Cross Impact Simulation (KSIM):
This is a program for interactive variables and is used to forecast business environments
in an international and national context and provides a representation of changes in a
system of variables over time; especially trends, events and structural relationships. The
program is widely used in the U S and users include the U S Army, U S Navy, NASA, National
Science Foundation and many multinational companies.
Trends Impact Analysis (TIA):
TIA is used for problems involving changes in trends at Industry and Company level and
produces a representation of changes in trend/s and event/s. A further representation of
probabilities is also produced. The program is widely used by U S multinational companies.
Cross Impact Analysis (CIA):
This is a program designed for use in solving project level problems, including new
product developments, and deals with a representation of cumulative probabilities of an
event over time. The model investigates events, structural relationships and probabilities
and is successfully used by many U S multinational companies.
IV. CONSUMER VALUES MODEL:
The use of Consumer Values models have two purposes. Firstly because it extends and
correlates market behaviour beyond such external forces as Disposable Income or
Demographics and secondly, it enhances the predictability of market behaviour by providing
insight into why consumers act as they do. There are trend projections to 2045 for all
Consumer Values; some 34 to 40 major cells. These values affect consumer spending on
definable items and markets. In the case of Capital Equipment one additional value is
used, namely, the monthly Business Confidence Monitor, which seeks to quantify purchasing
trends amongst buyers.
V. PRODUCT LIFE CYCLE MODEL:
The Product Life Cycle Model uses the normal innovation / diffusion Gompertz Function with
the added advantage of a matrix of industry critical correlations.
VI. BPI & QI MODELS: It is essential to effectively measure the relative buying
power of various market segments and geographic markets, this is done with a Buying Power
Index and a Quality Index. BPI is also useful for determining how effectively a company
uses its marketing effort. QI is used to analyse the ability of a market sector or
geographic market to purchase unessential goods with a high discretionary index.
Additionally, a number of other programs may have to be used, including:
i. Market Saturation Index;
ii. Inventory costs;
iii. Recorder points (Trade);
iv. MNR:MC ratios
VII. ADVERTISING EFFICIENCY MODELS:
These models evaluate the effect of revenue / advertising relationships over time and is
designed to investigate those functions of advertising efficiency which affect revenue and
to provide predictions on the actions of those factors over time.
The main functions of the model are:
1. The Sales Decay Constant, which measures advertising effect over time.
2. The Market Saturation Level, which investigates the effectiveness of the media mix and
the asymptotic values of the media expenditure.
3. The Sales Response Constant, which gives the ratio between revenue and advertising.
|
Program / Model Battery for Forecasting & Planning |
| |
O.E.C.D. Econometric Model |
PIMS Type Model |
Business Environment Forecasts |
Consumer / Buyer Values |
Product Life Cycle |
BPI +
QI |
Advertising Efficiency Model |
|
TRADE CELL |
|
|
K S I M |
|
|
|
|
|
NATIONAL CELL |
|
|
|
|
|
|
|
INDUSTRY CELL |
|
|
T I A |
|
|
|
|
|
COMPANY CELL |
|
|
|
|
|
|
|
PRODUCT CELL |
|
|
C I A |
|
|
|
|
|
END USER CELL |
|
|
|
|
|
|
|
|
|