|
SHORT-TERM CRITERIA
Marketing
Effect on Financial Performance
Total Sales; Domestic Sales; Exports; Pre-tax Profit;
Interest Paid; Non-trading Income; Operating Profit; Depreciation; Trading Profit; Fixed
Assets; Intangible Assets; Intermediate Assets; Total Fixed Assets; Stocks; Debtors; Other
Current Assets; Total Current Assets; Total Assets; Creditors; Short Term Loans; Other
Current Liabilities; Total Current Liabilities; Net Assets; Shareholders' Funds; Long Term
Loans; Other Long Term Liabilities; Capital Employed; Directors' Remunerations; Employees'
Remunerations; Total Employees.
Order Handling Process Expenditure; Customer Handling
Process Technology Expenditure; Total Order / Customer Handling Development Expenditure;
Customer Handling Equipment in Use within the range 0-3 years - 3-6 years - 6-9 years - 9+
years; Customer Handling Equipment Investment greater than Depreciation - Less than
Depreciation; Capital Expenditure on Customer Handling Equipment; Capital Expenditure on
Sales Offices; Capital Expenditure on Communications.
Sales Costs; Distribution & Handling Costs;
Advertising Costs; After-Sales Costs; Total Marketing Costs; Added Value; Product Pricing
as a % of the Market Average; New Products % Total Output; Index of Comparative Salesforce
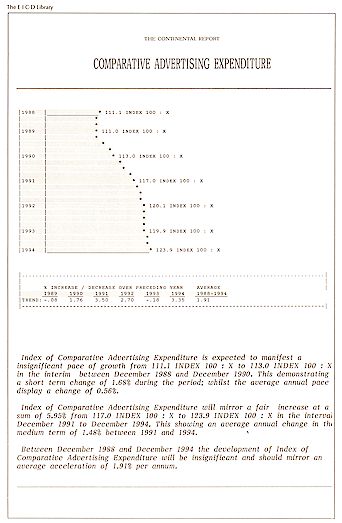
& Selling Expenditure; Index of Comparative Advertising Expenditure; Index of
Comparative General Promotional Expenditure; Customers - Wholesale - Retailer - OEM &
Manufacturing - Consumer & End User - Government.
Input Supplies / Materials and Energy Costs, Payroll
Costs, Total Operational & Process Costs, Sales Personnel Variable & Commission
Costs, Sales Expenses and Costs, Sales Materials Costs, Total Sales Costs, Distribution
Fixed Costs, Distribution Variable Costs, Warehousing Fixed Costs, Warehousing Variable
Costs, Physical Handling Fixed Costs, Physical. Handling Variable Costs, Physical Process
Fixed Costs, Physical Process Variable Costs, Total Distribution and Handling Costs,
Mailing & Correspondence Costs, Media Advertising Costs, Advertising Materials &
Print, POS & Display Costs, Exhibition & Events Costs, Total Advertising Costs,
Product Returns & Rejection Costs, Product Installation & Re-Installation Costs,
Product Breakdown & Post Installation Costs, Product Systems & Configuration
Costs, Product Service & Maintenance Costs, Customer Problem Solving & Complaint
Costs, Total After-Sales Costs, Total Marketing Costs, Total Operational Costs, New
Technology Expenditure, New Production Technology Expenditure, Research and Development
Expenditure, Capital Expenditure on Plant and Equipment, Capital Expenditure on
Structures, Capital Expenditure on Misc. Items, Total Capital Expenditure, Finished
Product Stocks, Work in Progress as Stocks, Materials as Stocks, Consumables + Supplies as
Stock, Debtors within Agreed Terms, Debtors Outside Agreed Terms, Un-recoverable Debts
Return on Capital, Return on Assets, Return on
Shareholders' Funds, Pre-tax Profit Margins, Operating Profit Margin, Trading Profit
Margin, Return on Investment, Assets Utilization ( Sales to Total Assets ), Sales Ratio of
Fixed Assets, Stock Turnover ( Sales : ratio of Stocks ), Credit Period, Creditors' Ratio
(Creditors : Sales x 365 days), Default Debtors given (Ratio of Total Debtors,
Un-Recoverable Debts (Ratio of Total Debts, Working Capital / Sales, Materials &
Energy Costs as a % of Sales, Added Value, Investment as a Ratio of Added Value, Value of
Plant & Equipment as a % of Sales, Vertical Integration (Value Added % of Sales),
Research & Development Investment % Sales, Capital Expenditure Investment % Sales,
Marketing Costs % of Sales, Current Ratio (Current Assets : Current Liabilities), Quick
Ratio, Borrowing Ratio (Total Debt : Net Worth), Equity Ratio (Shareholders Funds :
Liabilities), Income Gearing, Total Debt as a ratio of Working Capital, Debt Gearing Ratio
(Long Term Loans : Net Worth), Average Remuneration (full and part time), Profit per
Employee, Sales per Employee, Remuneration / Sales, Fixed Assets per Employee, Capital
Employed per Employee, Total Assets per Employee, Value of Average Investment per
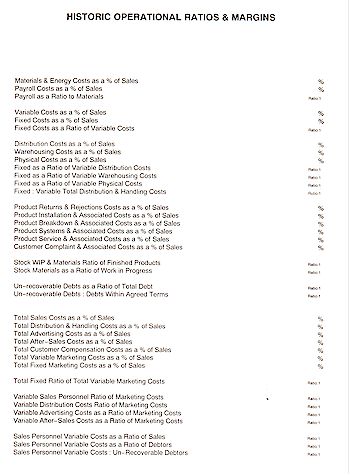
Employee, Value Added per Employee, Materials & Energy Costs as a % of Sales, Payroll
Costs as a % of Sales, Payroll as a Ratio to Materials, Variable Costs % of Sales, Fixed
Costs as a % of Sales, Fixed Costs as a Ratio of Variable Costs, Distribution Costs % of
Sales, Warehousing Costs % Sales, Physical Costs as a % of Sales, Fixed as a Ratio of
Variable Distribution Costs, Fixed as a Ratio of Variable Warehousing Costs, Fixed as a
Ratio of Variable Physical Costs, Fixed as a Ratio of Variable Total Distribution &
Handling Costs, Product Returns & Rejections Costs % of Sales, Product Installation
& Associated Costs as a % of Sales, Product Breakdown & Associated Costs as a % of
Sales, Product Systems & Associated Costs as a % of Sales, Product Service &
Associated Costs % of Sales, Customer Complaint & Ass. Costs % of Sales,Stock Work in
Progress & Materials : Ratio of Finished Products, Stock Materials as a Ratio of Work
in Progress, Un-recoverable Debts as a Ratio of Total Debt, Un-recoverable Debts as a
Ratio of Debts Within Terms, Total Sales Costs % of Sales, Total Distribution &
Handling Costs % of Sales, Total Advertising Costs as a % of Sales, Total After-Sales
Costs as a % of Sales, Customer Compensation Costs % of Sales, Total Variable Marketing
Costs % of Sales, Total Fixed Marketing Costs as a % of Sales, Total Fixed Marketing Costs
Ratio of Variable Marketing Costs, Variable Sales Personnel Costs as a Ratio of Marketing
Costs, Variable Distribution & Handling Ratio of Marketing Costs, Variable Advertising
Ratio of Marketing Costs, Variable After-Sales Ratio of Marketing Costs, Sales Personnel
Variable Costs : of Sales, Sales Person Variable Costs Ratio of Debts, Sales Personnel
Variable Costs Ratio of Un-Recoverable Debts, Exports as a % of Sales
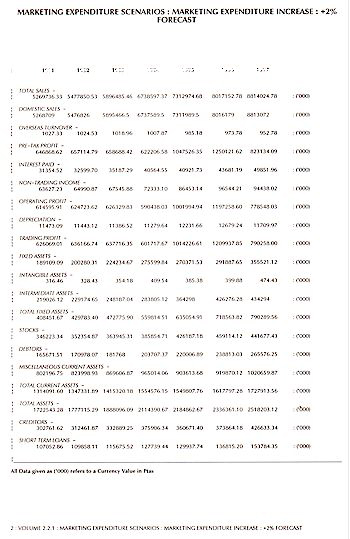
This section analyses the effects of decreases and
increases in Advertising and Marketing expenditure in terms of the target company's
Financial and Operational results. The forecasts are produced in respect of 12
scenarios, being 6 forecasts for increases in marketing expenditure (in the range +2% to
+12%) and 6 forecasts for decreases in marketing expenditure (in the ranges -2% to
-12%).
|
Example:
 |
|
Example:
 |
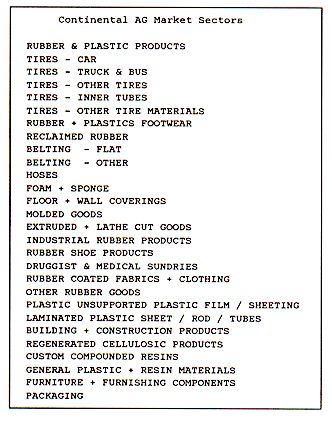
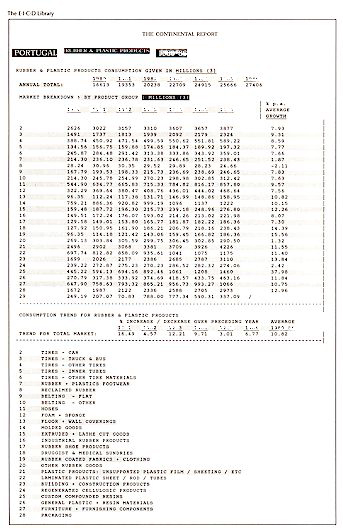
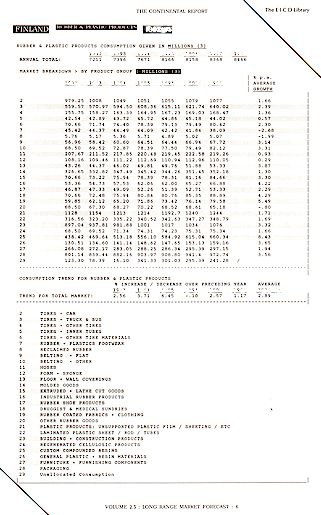
Markets
Market Consumption & Trend figures
by EACH Country / State
by EACH Product & Market
by YEAR to 2045.
Marketing Effect on Market Performance
Market Share (consisting of a breakdown giving data for
each year from 1997-2045) is analyzed in this section in terms of the Market Share
Effect of increases or decreases of advertising and marketing expenditure.
Market Share Changes and Market Share Trend figures are
given:-
by 10 ranges +1% to +10% increase in Advertising
+ Marketing Expenditure
by 5 ranges of -1% to -5% decrease in
Advertising + Marketing Expenditure
by EACH PRODUCT Group and/or MARKET Sector
by YEAR 1997 to the present
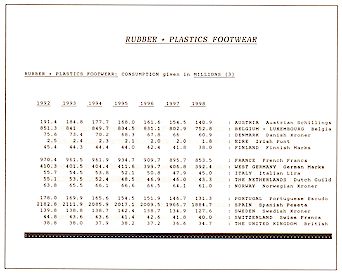
Product Profiles
Figures for Products are given
by Each country
by Each Product
by Each Year
This section provides Product Profile data for each
Product or Market sector in a matrix for all the countries or states covered by the
report.
Marketing Effect on Product Penetration
Figures for Products are given
by Each country
by Each Product
by Each Year (1997-2045)
This section provides Product Penetration data for each
Product or Market sector in a matrix for all the countries or states covered by the
report.
Product Summary
Figures for Products are given
by Each country
by Each Product
This section provides Product Summary for each Product or
Market sector in a matrix for all the countries or states covered by the report in the
Present and Medium-Term.
|
Example:
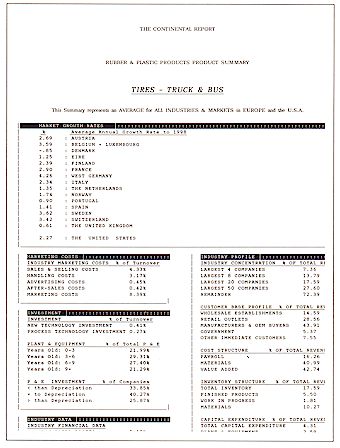 |
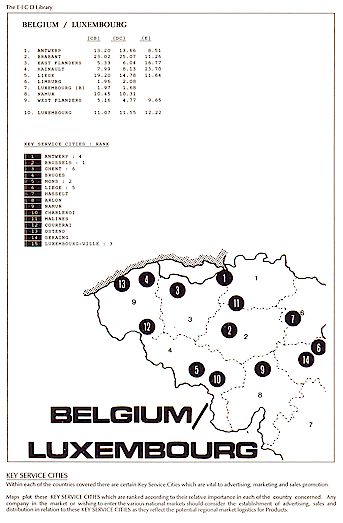
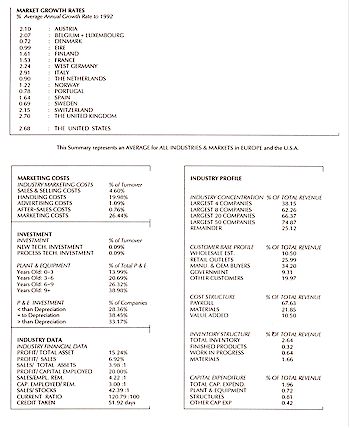
MARKET GROWTH RATES
% Average Annual Growth Rate to the year 2045 Given for each of 16 national markets critical to the Company.
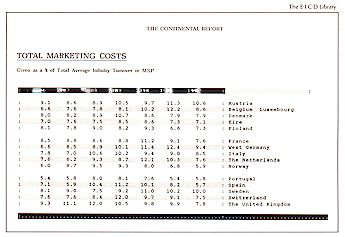
MARKETING COSTS INDUSTRY MARKETING COSTS % of
Turnover: Sales & Selling, Handling, Advertising, After-sales, Marketing
costs.
|
Example:
 |
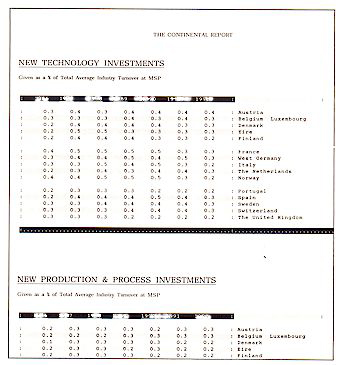
INVESTMENT INVESTMENT % of Turnover: New
technology investment, Process technology investment.
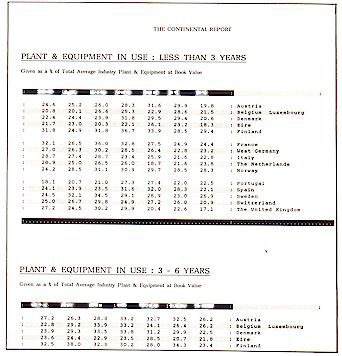
PLANT & EQUIPMENT % of Total P
& E: Years in use: 0-3 / 3-6 / 6-9 / 9+. P & E INVESTMENT % of Companies:
Less than, Equal to and Greater than Depreciation.
|
Example:
 |
INDUSTRY DATA INDUSTRY FINANCIAL DATA:
Profit/total asset, Profit/ sales, Sales/total assets, Profit/capital employed,
Sales/employee remuneration, Capital employed/remuneration, Sales/stocks, Current ratio,
Credit taken.
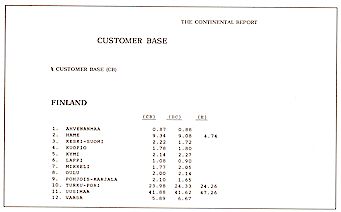
INDUSTRY PROFILE INDUSTRY CONCENTRATION % of
total revenue: Largest 4 / 8 / 20 / 50 companies. CUSTOMER BASE PROFILE % of total
revenue: Wholesale, retail, manufacturing-OEM, government, public, others. COST
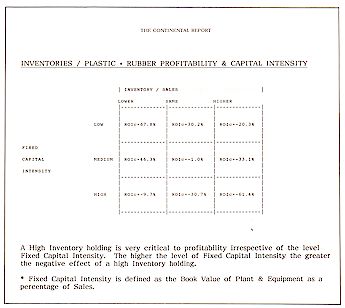
STRUCTURE % of total revenue: Payroll, Materials, Value added. INVENTORY STRUCTURE
% of total revenue: Total inventory, Finished products, Work in progress, Materials. CAPITAL
EXPENDITURE % of total revenue: Total capital expenditure, Plant & equipment,
Structures, other. [3]
|
Example:
 |
INDUSTRY INVESTMENT New Technology Investments;
Production/Process Technology Investment; Plant & Equipment in Use; Plant &
Equipment Investments.
INDUSTRY FINANCES Return on Capital; Return on
Assets; Return on Shareholders' Funds; Pre-tax Profit Margins; Operating Profit Margin;
Trading Profit Margin; Assets Utilisation; Sales as a ratio of Fixed Assets; Stock
Turnover; Credit Period; Creditors' Ratio; Working Capital/ Sales; Current Ratio; Quick
Ratio; Borrowing Ratio; Equity Ratio; Income Gearing; Total Debt as a ratio of Working
Capital; Debt Gearing Ratio; Average Remuneration; Profit/ Employee; Sales/ Employee;
Remunerations/ Sales; Fixed Assets/ Employee; Capital Employed/Employee; Total
Assets/Employee; Exports as a % of Sales Materials and Energy Costs; Payroll Costs; Total
Process Costs; Sales Costs; Distribution & Handling Costs; Advertising Costs;
After-Sales Costs; Total Marketing Costs; Added Value.
INDUSTRY STRUCTURE Concentrations; Customer Base
Profile; Employment; Cost Structures; Inventory Structures; Capital Expenditure
Breakdowns; Asset Structures.
|
Example:
 |
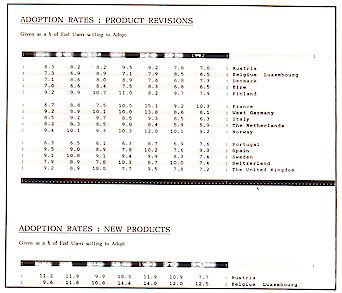
Product Launch / Revision Data: adoption rates
:product revisions + new products / conversion ratios :revisions + new products /
potential 1st year growth: revisions + new products.
|
Example:
 |
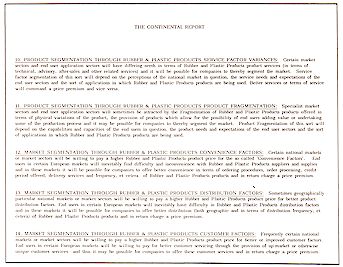
Market Segmentation: Pricing - lower price -v-
higher price; availability - greater -v- reduced availability; convenience factors;
distribution factors; customer factors; psychographics; branding; multi-branding; market
stretching.
Product Segmentation Higher quality; - lower
quality; performance variances; technological & technical factors; warranty variances;
service factor variances; product fragmentation.
|
Example:
 |
Tactical Marketing Data
The tactical commentary is designed to review, analyse and
isolate certain critical logistic questions which indicate the short-term prospects for
the Target company.
Profitability ~ Productivity ~ Market Shares ~ Customers'
Awareness ~ Customers' Perceptions ~ Customers' Rating of Sales Promotion Activity ~
Customers' Rating of Advertising Posture ~ Customers' Rating of Product Availability ~
Customers' Rating of Technical Competence ~ Customers' Awareness of Products ~ Customers'
Awareness of Product Quality ~ Customers' Awareness of Product Pricing ~ Customers'
Perception of Pricing Relative to Competitors ~ Customers' Perception of Quality Relative
to Competitors ~ Customers' Perception of Relative Product Performance ~ Customers'
Perception of Relative Technical Superiority ~ Customers' Perception of Relative Service
Factors ~ Current Customer Base ~ Annual Sales of Products & Services ~ Current Sales
~ Costs & Margins ~ Distribution Channels & Networks ~ Pre-Tax Profit / Total
Assets ~ Pre-Tax Profit / Sales ~ Pre-Tax Profit / Capital Employed ~ Pre-Tax Profit Per
Employee ~ Investment / Sales ~ Receivables / Sales ~ Inventory / Sales ~ Physical Process
Costs / Sales ~ Total Marketing Costs / Sales ~ R&D Expenditure / Sales ~ Added Value
~ Capacity Utilisation ~ Relative Product Quality ~ Relative Product Pricing ~ Competitors
~ Competitors' Strength ~ New Products ~ Product Life Cycle ~ New Product Horizons ~
Relative Competitive Sales-Force Expenditure ~ Relative Competitive Advertising
Expenditure ~ Relative Competitive Promotional Expenditure
Short Term Marketing Issues
This section has a written and graphic analysis of the
various aspects of the Company's short term tactical issues and relative performance in
the Market-Place. The data is given as a matrix by Subsidiary, Division, Unit or Market
sector.
Market Values, Conclusions on the Company's Products,
Product & Market Segmentation: Pricing, Quality, Availability, Performance Variances,
Technological & Technical Factors, Warranty Variances, Service Factors, Product
Fragmentation, Convenience Factors, Distribution Factors, Customer Factors,
Psychographics, Branding, Multi-Branding, Market Stretching, Merchandising, Pricing &
Pricing Structures: Recommendations on Pricing, Sales force Requirements: Comments on
Sales force & Recommendations, Marketing Back-up for Sales force & Distribution
Networks, The Market-Place for the Company: Customer Base -v- Distribution Channels,
Routes to the Company's Market: Distribution Recommendations, Distribution Logistics &
Distribution Support Systems: The Distribution Control System - Facilities, Network, et
cetera., Distribution & Handling Costs, Inventory & Sales/Stock Levels &
Norms, Buying & Service Promptness Norms, Warranty & After-Sales Services:
Warranty & After-Sales Cost: Rating of the Company's Warranty & After-Sales
Services, Advertising & Sales Promotion: Advertising & Sales Promotion Costs, End
User Targets, End User Factors, Relative Quality Demanded by End User Sectors, Branding
& the Company's Products, Joint Ventures, Short Term Investment Areas.
|
Marketing Factors
Figures
are given:-
by EACH COUNTRY / STATE / REGION
by YEAR.
PRODUCT FACTORS: Quality. Approvals. Design factors
/ design specifications. Physical criteria / physical parameters. R&D costs /
development costs / customisation. Technology / technology factors & development.
Product life / longevity. Performance / product efficiency / product integrity.
Reliability / product failure / product defects. Operating criteria / product operation or
usage. Probability of technical development / technical. Product life cycle / product
obsolescence.
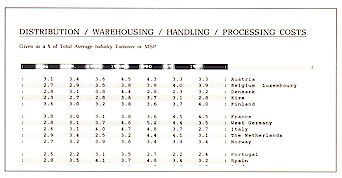
MARKETING FACTORS: Distribution / warehousing /
handling costs. Costs/prices at supplier sale price. Costs/prices at end user / retail
sale price. Stock availability / lead times / delivery. Sales promotion & sales costs.
Advertising posture & advertising costs. Competition / competitors' aggressiveness
& posture. Market share / relative market shares. Seasonality / cyclical demand /
demand fluctuations. Sensitivity to economic climate & conditions. After-sales
factors.
SUPPLIER FACTORS: Processing / production /
handling facilities & capacity. Processing/ handling capacity / flexibility of plant.
Dependence on sub-contractors / in-house supplies. Technical capabilities / new product
developments. Technological aptitude & innovations. Other capacity. Own buying
influence / economies of scale. Alternative suppliers base. Commitment/capacity of other
suppliers. Price advantages & pricing amongst other suppliers. Conditions of sale /
terms of trading.
DISTRIBUTION / CUSTOMER INTERFACE FACTORS:
Technical / marketing capabilities & capacity. Distribution facilities & manpower
availability. Commitment to other suppliers. Sales volumes / turnover required. Margins /
added value. Captive customer base / customers handled. Area/s serviced & geographic
coverage. Sales promotion / advertising / sales force. Effects on existing products &
customer base. Cash-flow requirements of distribution channel. Capital requirements.
CUSTOMER FACTORS: Propensity to consume / demand
factors. Product purchase background / past product purchase. Purchasing criteria -
commercial. Purchasing criteria - motivational. Purchase price / acquisition costs /
product costs. DMU susceptibility / customer awareness.
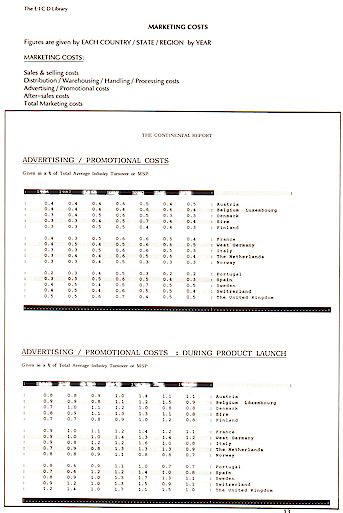
Marketing Costs Sales & selling
costs; sales & selling costs :During product launch; distribution / warehousing /
handling / processing costs; distribution / warehousing / handling / processing costs
:during product launch; advertising / promotional costs; advertising / promotional costs
:during product launch; after-sales costs; after-sales costs :product launch; total
marketing costs; total marketing costs :product launch.
|
Example:
 |
|
Example:
 |
MARKETING COSTS
Figures for the Products are given by EACH COUNTRY / STATE /
REGION by YEAR to 2045: Sales & selling costs; Distribution / warehousing / handling /
processing costs; Advertising / promotional costs; Total marketing costs.
|
Example:
 |
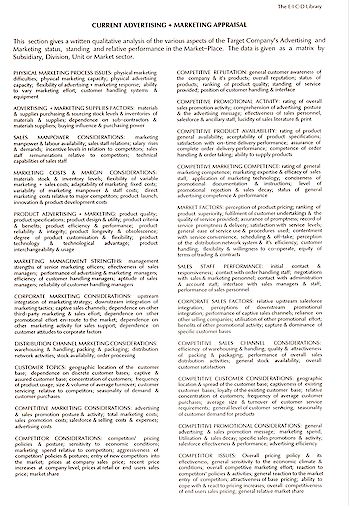
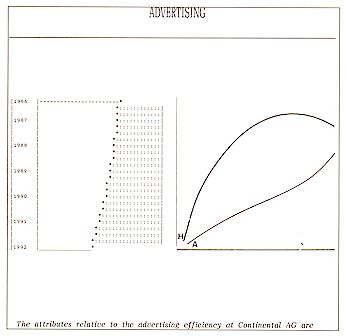
Current Advertising & Marketing Appraisal
This section gives a written qualitative analysis of the
various aspects of the Target Company's Advertising and Marketing status, standing and
relative performance in the Market-place. The data is given as a matrix by
Subsidiary, Division, Unit or Market sector.
It is important to establish the compatibility between the
Company and the Product, Marketing, Retailer, Sales Point - Customer Interface and
Customer factors and parameters in each of the markets investigated in the
report: this analysis provides the necessary data.
Obviously such an analysis can assist readers in reviewing
the areas which might produce problems for the marketing of the product - and also areas
of opportunity which may be manipulated by the company when marketing and advertising the
product/s in each of the areas concerned.
The foremost purpose of this commentary is
of course to supply a rational and objective basis with which to correlate and assess the
factors and parameters indispensable to the company in the provision of products and
services.
BASIS OF THE ANALYSIS
The general basis of the following analysis is the
comparison of the company and the various competitors which exist in the major Trade Cell
markets and industries in which the company operates.
The comparison is made in terms of the Strengths and
Weaknesses of both the company and the major competitors which together accounts for 80%
of the cumulative Market Share in the Trade Cell.
The data is gained from research into the company's
Customer and Distribution Channel Bases as well as those of the other major competitors in
each of the Trade Cells markets.
The forecasted performance of the company is a function of
the company's strengths and weaknesses in relation to that of its competitors. This
function and the conclusions thereof drawn are projected from the various forecasts
contained below.
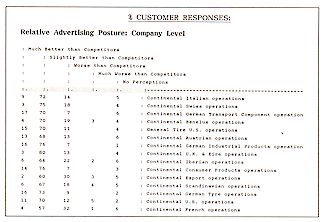
Competitive Analysis for Advertising & Marketing
PRESENTATION OF THE ANALYSIS
This section analyses some 180 major items in relation to
15 product and market sectors. Thus some 2700 competitive considerations and issues are
discussed and analysed.
Clearly it would be extremely difficult, and indeed
overwhelming in length, to produce this analysis only in prose and thus the data is
presented in terms of a graph as well as a written analysis in prose.
In order to interpret this presentation it is necessary to
understand the various factors being considered in the analysis. These factors include:-
1. The relative strength, weakness and performance of the
company in terms of all relevant product and markets sectors.
2. The relative strengths, weaknesses and performance of the
competitors in terms of all relevant product and markets sectors.
3. The average strengths, weaknesses and performance of the
competitors in terms of all relevant product and markets sectors.
4. The Market and Industry in which the company operates and
the prevailing norms and expectations.
5. All the above factors when forecast individually, in
relation to the product Markets and Industries, and thereafter projected in the Medium
Term.
COMPETITOR, physical process considerations,
supplies considerations, manpower considerations, costs & margin considerations,
product considerations, management strengths, corporate considerations, distribution
channel considerations, customer considerations, marketing considerations,
considerations,
RELATIVE reputation, promotional activity, product
availability, technical competence, marketing factors, staff performance, corporate
considerations, distribution channel considerations, customer considerations, promotional
considerations,
COMPETITOR considerations, production
considerations, supplies considerations, manpower considerations, costs & margin
considerations, product considerations, management strengths, corporate considerations,
distribution considerations, customer considerations, marketing considerations,
RELATIVE reputation, promotional activity, product
availability, technical competence, marketing factors, staff performance, corporate
considerations, distribution considerations, customer considerations, promotional
considerations, competitor considerations.
|
Example:
 |
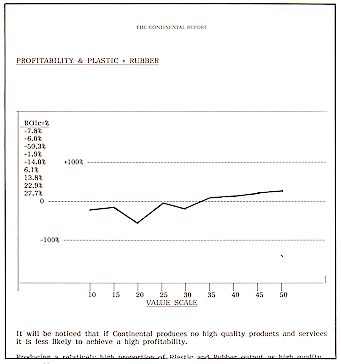
The graph projects data to form a forecast and this is
intended to show the relative performance of the company in relation to the overall Market
and Industry Expectations. These Expectations may be greater than or less than the levels
provided by the company and the competitors.
The graph compares the performance of the company with the
Trade Cell Market and Industry in which the company operates, with the major competitors
and with the norms and expectations of the Market and Industry.
The object of the graph is to give a visual representation
of the many qualitative considerations and issues which in total comprise the performance
of the company in relation to Market and Industry averages.
The data analysis includes comparative data on the major
competitors which the company encounters in the Trade Cell.
All graphs in this section are presented in the above
manner because many of our readers order this section in the form of acetate sheets (for
overhead projection) and thus the graphs are produced using (as far as possible) a
standard scale and base line. Further the graphs can be overlaid, one atop the other, to
emphasise the relative features of the graphs and the scale and axis allows this to be
done effectively during overhead projection.
The prose generated compares the performance of the
company with the Competitors in the Trade Cell Market in which the company operates.
The analysis is given in two sentences:-
1. The first sentence looks at the performance of the
company in relationship to the other competitors in the Trade Cell.
In addition a forecast is given for the Medium Term and
this forecast is also indicated on the graph as "*".
In some instances a company may be performing (or forecast
to perform) well against other competitors, yet the graph (*) may show that this aspect is
deteriorating. The interpretation of this if that Expectations are rising but in general
the suppliers in the market are not meeting those expectations - whilst the company's own
performance in generally better than that of the competition.
2. The second sentence gives a recommendation on action,
and where necessary, indicates the importance of the factor being analysed.
The data analysis includes comparative data on the major
competitors which the company encounters in the Trade Cell.
The prose produced here is entirely computer generated
and a program is used to emphasise problems and opportunities through the full use of the
language. The program does, where possible, seek to create lively English prose.
The adjectives and adverbs used are representative of
the criticalness or seriousness of the points being made and thus the computer produces
and uses a ranking and scale of words which objectively reflect the importance or
otherwise of the factors being analysed.
Competitive Marketing Issues &
Considerations
COMPETITIVE ISSUES
The following section provides a forecast of a number of
issues and questions for the company in relation to the other competitors in the market.
These issues are examined under the following headings:-
The term "Relative" denotes the relationship
between the various activities of the company and other competitors in the marketplace.
COMPETITOR PERFORMANCE :
RELATIVE: customer confidence, reputation, staff
efficiency, staff performance, staff integrity, truth & honesty, written
communications, verbal contact, customer handling, customer complaint handling, customer
problem solving, comprehension of product, awareness of product, customer confidence in
product, customer service, initial customer response, information for customers,
promotional activity, advertising posture, contract documentation.
COMPETITOR: customer survey, competitor product
factors, competitor marketing factors, competitor supplier factors, competitor
distribution / customer interface factors, competitor customer factors.
|
Example:
 |
SHORT-TERM COMPETITIVE ISSUES
SECTOR COVERAGE THIS SECTION COMPARES THE COMPANY
WITH THEIR MAJOR COMPETITORS WITHIN THE TRADE CELL ~ Overall awareness by customers ~
Overall reputation ~ Reputation of products ~ Reputation of product quality ~ Reputation
of service provided ~ Reputation of customer handling ~ Rating of overall sales promotion
activity ~ Rating of advertising ~ Rating of sales personnel ~ Rating of sales print ~
Rating of product availability ~ Rating of product specifications ~ Rating of on-time
delivery ~ Rating of complete order delivery ~ Rating of order handling ~ Rating of
ability to supply ~ Rating of marketing competence ~ Rating of marketing awareness ~
Rating of marketing technology ~ Rating of promotional documentation ~ Rating of
promotional + sales decay ~ Rating of advertising competence ~ Perception of product
pricing ~ Product superiority ~ Customer service ~ Prompt delivery ~ Service promptness ~
Service levels ~ Service procedures ~ Service convenience ~ Product delivery system ~
Flexibility of customer handling ~ Perceptions of terms of trading ~ Initial contact ~
Order handling staff ~ Sales staff ~ Administration staff ~ Sales management ~ Sales
personnel ~ Upstream sales integration ~ Downstream promotional integration ~ Captive
sales channels ~ Reliance on selling outlets ~ Utilisation of other promotional effort ~
Benefits of other marketing ~ Captive customer bases ~ Warehousing & handling ~
Packing & packaging ~ Sales activity ~ Product availability ~ Customer satisfaction ~
Location of customers ~ Captiveness of the customer base ~ Customer base loyalty ~
Concentration of purchases ~ Purchase frequency ~ Order size ~ Customer servicing ~
Seasonality ~ Advertising & sales promotion ~ Marketing ~ Sales promotion ~ Sales
force ~ Advertising ~ Pricing policy ~ Economic conditions ~ Relative marketing effort ~
Reaction to competitors ~ New competitors ~ Prices at msp ~ Price increases ~ Prices at
rsp ~ Market share
SHORT-TERM COMPETITIVE CONSIDERATIONS
CORPORATE COVERAGE THIS SECTION COMPARES THE
COMPANY WITH THEIR MAJOR COMPETITORS WITHIN THE TRADE CELL ~ Physical marketing
difficulties ~ Physical marketing capacity ~ Physical advertising capacity ~ Flexibility
of advertising response ~ Ability to vary marketing effort ~ Customer handling systems
& equipment ~ Advertising + marketing materials acquisition & sources ~
Advertising & marketing materials stock levels ~ Dependence on advertising + marketing
contractors & agents ~ Advertising buying influence ~ Sales manpower availability ~
Sales staff relations ~ Pressure of sales force wage rises ~ Relative sales payroll levels
~ Relative sales incentive levels ~ Sales force technical capabilities ~ Marketing
materials stock levels ~ Variable marketing costs ~ Fixed marketing costs ~ Marketing
payroll costs ~ Direct marketing costs relative to competitors ~ Product development costs
~ Quality ~ Product specifications ~ Design ~ Operating criteria ~ Product efficiency ~
Product reliability ~ Product longevity ~ Product life cycle ~ Product customisation ~
Product technology ~ Product usage ~ Management strengths: senior marketing personnel ~
Management strengths: sales force managers ~ Management strengths: sales & marketing
staff ~ Management strengths: customer handling managers ~ Management strengths: technical
aptitude ~ Management strengths: customer handling reliability ~ Upstream marketing
strategies ~ Downstream marketing tactics ~ Captive marketing channels ~ Dependence on
external marketing ~ Dependence on external promotion ~ Dependence on external marketing
support ~ Dependence on customers attitudes ~ Warehousing & handling ~ Packing &
packaging ~ Distribution ~ Product availability ~ Order processing ~ Location of customers
~ Dependence on customer base ~ Captive customer base ~ Concentration of customers ~
Product usage frequency ~ Order value ~ Relative customer servicing ~ Seasonality of
demand ~ Advertising & sales promotion ~ Marketing costs ~ Sales promotion costs ~
Selling costs ~ Advertising costs ~ Competitors' pricing policy ~ Sensitivity to economic
conditions ~ Relative marketing spend ~ Competitors' aggressiveness ~ Entry of new
competitors ~ Prices at msp ~ Price increases at msp ~ Prices at rsp ~ Market share. |
 EUROPEAN INSTITUTE FOR COMMUNITY DEVELOPMENT