PHYSICAL DISTRIBUTION + CUSTOMER HANDLING
Company Products & Services
PHYSICAL DISTRIBUTION + CUSTOMER HANDLING
CONTENTS
|
Page: |
PHYSICAL DISTRIBUTION + CUSTOMER HANDLING FOR THE INDUSTRY |
|
~ .. PHYSICAL DISTRIBUTION + CUSTOMER HANDLING |
|
|
~ .... PHYSICAL DISTRIBUTION SYSTEM FLOW CHART |
|
|
~ ...... DISTRIBUTION SCOPE |
|
|
~ ............ DISTRIBUTION EFFICIENCY |
|
|
~ ~ ...... Distribution Planning & Accounting |
|
|
~ ~ ...... Process Management & Handling |
|
|
~ ~ ...... Physical Distribution Efficiency |
|
|
~ ~ ...... Point of Sale & Customer Service Efficiency |
|
|
~ ~ ...... Order Handling & Processing |
|
|
~ ~ ............ Operations |
|
|
~ ~ ............ Markets + Trade Cell |
|
|
~ ~ ............ Products |
|
|
~ ~ ............ Competitors |
|
|
~ .... PHYSICAL DISTRIBUTION OBJECTIVES |
|
|
~ ...... Level of Service |
|
|
~ .... HISTORIC MARKETING COSTS & MARGINS |
|
|
~ ...... SALES COSTS |
|
|
~ ...... DISTRIBUTION + HANDLING COSTS |
|
|
~ ...... ADVERTISING COSTS |
|
|
~ ...... AFTER-SALES COSTS |
|
|
~ ...... TOTAL MARKETING COSTS |
|
|
~ .... HISTORIC MARKETING COST RATIOS & MARGINS |
|
|
~ ...... PROFIT RATIOS |
|
|
~ ...... MARKETING RATIO |
|
|
~ ...... MARKETING OPERATIONAL RATIOS |
|
|
~ ...... MARKETING COSTS |
|
|
~ .... MARKETING COSTS FORECAST |
|
|
~ ...... SALES COSTS FORECAST |
|
|
~ ...... DISTRIBUTION + HANDLING COSTS FORECAST |
|
|
~ ...... ADVERTISING COSTS FORECAST |
|
|
~ ...... AFTER-SALES COSTS FORECAST |
|
|
~ ...... TOTAL MARKETING COSTS FORECAST |
|
|
~ .... MARKETING MARGINS + RATIOS FORECAST |
|
|
~ ...... PROFIT RATIOS FORECAST |
|
|
~ ...... MARKETING RATIOS FORECAST |
|
|
~ ...... MARKETING OPERATIONAL RATIOS FORECAST |
|
|
~ ...... MARKETING FACTORS FORECAST |
|
|
~ ...... Cost of service |
|
|
~ ...... Service objective |
|
|
~ ............ LEVEL + COST OF SERVICE |
|
|
~ ~ ...... Level of Service: Responsiveness |
|
|
~ ~ ...... Level of Service: Problem Solving |
|
|
~ ~ ...... Level of Service: Product / Price / Service Factors |
|
|
~ ~ ...... Cost of Service: Functional Costs |
|
|
~ ~ ...... Cost of Service: Physical Handling Costs |
|
|
~ ~ ............ Operations |
|
|
~ ~ ............ Markets + Trade Cell |
|
|
~ ~ ............ Products |
|
|
~ ~ ............ Competitors |
|
|
~ ............ DISTRIBUTION COSTS |
|
|
~ ~ ...... Distribution & Storage Fixed Costs |
|
|
~ ~ ...... Distribution & Storage Variable Costs |
|
|
~ ~ ...... Physical Handling & Process Fixed Costs |
|
|
~ ~ ...... Physical Handling & Process Variable Costs |
|
|
~ ~ ...... Total Distribution Costs |
|
|
~ ~ ............ Operations |
|
|
~ ~ ............ Markets + Trade Cell |
|
|
~ ~ ............ Products |
|
|
~ ~ ............ Competitors |
|
|
~ .... ALTERNATIVES IN PHYSICAL DISTRIBUTION |
|
|
~ ...... Single Location - Single Market |
|
|
~ ...... Single Location, Multiple Markets |
|
|
~ ...... i. Direct handling of customers |
|
|
~ ...... ii. Bulk handling / local facility |
|
|
~ ...... iii. Part processing / local or remote |
|
|
~ ...... iv. Full processing / local or remote |
|
|
~ ...... Multiple Locations - Multiple Markets |
|
|
~ ............ PHYSICAL DISTRIBUTION |
|
|
~ ~ ...... Single Location / Single Markets |
|
|
~ ~ ...... Single Location / Multiple Markets: Direct Handling |
|
|
~ ~ ...... Single Location / Multiple Markets: Bulk Handling |
|
|
~ ~ ...... Single Location / Multiple Markets: Split Processing |
|
|
~ ~ ...... Multiple Location / Multiple Markets |
|
|
~ ~ ............ Operations |
|
|
~ ~ ............ Markets + Trade Cell |
|
|
~ ~ ............ Products |
|
|
~ ~ ............ Competitors |
|
|
~ .... PRODUCT AVAILABILITY DECISIONS |
|
|
~ ...... Product Supply & Availability |
|
|
~ ...... i. Supply Timing |
|
|
~ ...... ii. Supply Quantity |
|
|
~ .... LOCATION DECISIONS |
|
|
~ ...... Types of Location Decisions |
|
|
~ ...... i. Selecting the area |
|
|
~ ...... ii. Selecting the site |
|
|
~ .... DISTRIBUTION RESPONSIBILITY |
|
|
~ ...... Divided Authority |
|
|
~ ...... Organizational Alternatives |
|
|
~ ............ DISTRIBUTION DECISIONS |
|
|
~ ~ ...... Product Availability Timing Efficiency |
|
|
~ ~ ...... Product Availability Quantity Efficiency |
|
|
~ ~ ...... Locations Efficiency |
|
|
~ ~ ...... Organizational Efficiency |
|
|
~ ~ ...... Organizational & Decision Flexibility |
|
|
~ ~ ............ Operations |
|
|
~ ~ ............ Markets + Trade Cell |
|
|
~ ~ ............ Products |
|
|
~ ~ ............ Competitors |
|
|
~ .... DISTRIBUTION CHANNEL INVESTMENT EFFECT FORECASTS |
|
|
~ .... Distribution Channel Improvement Scenario Balance Sheet Forecast |
|
|
~ ...... Distribution Channel Improvement Scenario Operational Costs Forecast |
|
|
~ ........ Distribution Channel Improvement Scenario Financial Ratios |
|
|
~ .......... Distribution Channel Improvement Scenario Operational Margins |
|
|
~ .... Financial forecast notes |
|
|
~ .... HISTORIC FINANCIAL DATA |
|
|
~ .... Historic Balance Sheet |
|
|
~ ~ ...... Historic Costs & Margins |
|
|
~ ~ ........ Historic Financial Ratios & Margins |
|
|
~ ~ .......... Historic Operational Ratios & Margins |
|
|
~ .... Financial forecast notes |
|
|
~ .... DISTRIBUTION + CUSTOMER HANDLING FINANCIAL FORECASTS |
|
|
~ .... Fixed Marketing Cost Objectives Balance Sheet Forecast |
|
|
~ ...... Fixed Marketing Cost Objectives Operational Costs Forecast |
|
|
~ ........ Fixed Marketing Cost Objectives Financial Ratios |
|
|
~ .......... Fixed Marketing Cost Objectives Operational Margins |
|
|
~ .... Distribution & Product Delivery Cost Objectives Balance Sheet Forecast |
|
|
~ ...... Distribution & Product Delivery Cost Objectives Operational Costs Forecast |
|
|
~ ........ Distribution & Product Delivery Cost Objectives Financial Ratios |
|
|
~ .......... Distribution & Product Delivery Cost Objectives Operational Margins |
|
|
~ .... Order Taking Improvements Balance Sheet Forecast |
|
|
~ ...... Order Taking Improvements Operational Costs Forecast |
|
|
~ ........ Order Taking Improvements Financial Ratios |
|
|
~ .......... Order Taking Improvements Operational Margins |
|
|
~ .... Customer / Order Processing Systems Investment Balance Sheet Forecast |
|
|
~ ...... Customer / Order Processing Systems Investment Operational Costs Forecast |
|
|
~ ........ Customer / Order Processing Systems Investment Financial Ratios |
|
|
~ .......... Customer / Order Processing Systems Investment Operational Margins |
|
|
~ .... Systems Investment Balance Sheet Forecast |
|
|
~ ...... Systems Investment Operational Costs Forecast |
|
|
~ ........ Systems Investment Financial Ratios |
|
|
~ .......... Systems Investment Operational Margins |
|
|
~ .... Profit Impact From Distribution Cost Reduction Balance Sheet Forecast |
|
|
~ ...... Profit Impact From Distribution Cost Reduction Operational Costs Forecast |
|
|
~ ........ Profit Impact From Distribution Cost Reduction Financial Ratios |
|
|
~ .......... Profit Impact From Distribution Cost Reduction Operational Margins |
|
|
~ .... Profit Impact From Customer Handling Cost Reduction Balance Sheet Forecast |
|
|
~ ...... Profit Impact From Customer Handling Cost Reduction Operational Costs Forecast |
|
|
~ ........ Profit Impact From Customer Handling Cost Reduction Financial Ratios |
|
|
~ .......... Profit Impact From Customer Handling Cost Reduction Operational Margins |
|
|
~ .... Capital Investments Options: Distribution / Handling Balance Sheet Forecast |
|
|
~ ...... Capital Investments Options: Distribution / Handling Operational Costs Forecast |
|
|
~ ........ Capital Investments Options: Distribution / Handling Financial Ratios |
|
|
~ .......... Capital Investments Options: Distribution / Handling Operational Margins |
|
|
~ .... Capital Investments Options: Customer Handling Systems Balance Sheet Forecast |
|
|
~ ...... Capital Investments Options: Customer Handling Systems Operational Costs Forecast |
|
|
~ ........ Capital Investments Options: Customer Handling Systems Financial Ratios |
|
|
~ .......... Capital Investments Options: Customer Handling Systems Operational Margins |
|
|
~ .... Customer Handling Improvements Balance Sheet Forecast |
|
|
~ ...... Customer Handling Improvements Operational Costs Forecast |
|
|
~ ........ Customer Handling Improvements Financial Ratios |
|
|
~ .......... Customer Handling Improvements Operational Margins |
|
|
~ .... Financial data definitions |
|
PHYSICAL DISTRIBUTION + CUSTOMER HANDLING
Just as the marketing concept is receiving increasing recognition by the
industry there needs to be a similar awareness of the physical distribution
concept. When managers of various departments make decisions only with
reference to their own framework, they affect each other's costs and demand
creation influences but do not take them into consideration. The physical
distribution concept calls for treating all these decisions within a unified
total systems framework. Then the important task becomes that of designing
physical distribution arrangements that minimize the cost of providing a given
level of customer service.
To improve performance the industry can choose from a number of alternative
physical distribution strategies, ranging from direct customer handling to
local and remote outlets, to local sub-processing to local complete customer
processing. It must develop product supply policies that reconcile the value of
a high level of customer service with the need to economies on product carrying
costs. It must find more accurate ways to evaluate alternative general areas
and specific sites for marketing expansion. It must review the whole question
of organizational responsibility for physical distribution, particularly how to
co-ordinate the various decisions and where leadership should be located in the
organization.
In this part of the report one must deliberately emphasize the planning rather
than the operations aspects of physical distribution. Physical distribution is
an area where good systems design counts for as much as or more than good
operations management. Nevertheless, many of the potential economies come from
improved management of the existing system.
In the industry, the term "marketing" has connoted two different but
related processes, the first dealing with the search for and stimulation of
buyers and the second with the physical distribution of the product. With the
increased competition for markets, marketing executives in the company have
devoted the bulk of their time to the search and stimulation function. Their
attention has been given over to developing a mix of products, prices,
promotion, and channels that would keep demand high and growing. They have
viewed physical distribution, or the logistics of getting products to the
buyers, as a supportive and subsidiary activity.
More recently, several developments have awakened the company management's
interest in the logistics problem and led them to wonder whether they were not
overlooking many opportunities, not only for cost saving but also for improved
demand stimulation.
One of the alerting factors is the increase in the cost for such physical
distribution services as transport, storage & handling and customer
servicing. Transport, storage and handling bills are rising as a result of
increased labor and equipment costs. The customer servicing bill is rising
because buyers are tending to place smaller orders more frequently, and
suppliers are tending to expand the width and depth of their lines. Many
company executives have been shocked to learn that the total costs of storing,
handling, and moving their products are anywhere between 5 and 30 percent of
sales.
Increasing numbers of company managers argue that substantial savings can
usually be effected in the physical-distribution area, which has been
accurately described as "the last frontier for cost economies". There
is much evidence of un-coordinated physical-distribution decisions resulting in
sub-optimization. Not enough use is being made of modern decision tools for
determining economic levels of customer service, efficient modes of handling, and
sound process, handling, and storage locations.
Furthermore, physical distribution is a potent instrument in the
demand-stimulation process. Companies can gain by offering more in the way of
service or by cutting prices through successfully reducing physical-distribution
costs.
PHYSICAL DISTRIBUTION SYSTEM FLOW CHART
|
PHYSICAL DISTRIBUTION SYSTEM FLOW CHART |
||||
|
|
|
Distribution Planning & Accounting |
|
|
|
|
|
|
|
|
|
Input Supplies & Handling |
|
Supply + Process Management |
|
Order Processing |
|
|
|
|
|
|
|
|
|
Packaging & Print |
|
|
|
|
|
|
|
|
|
|
|
In-House Process |
|
|
|
|
|
|
|
|
|
|
|
Handling & Storage |
|
|
|
|
|
|
|
|
|
|
|
Physical Distribution |
|
|
|
|
|
|
|
|
|
|
|
Point of Sale |
|
Customer Service |
DISTRIBUTION SCOPE
There is a broad and narrow view of the scope of physical distribution.
In the Broad View, physical distribution starts
with the location of original materials and labor inputs required in the
productive process and stretches to the location of final consumer markets.
This perspective is particularly pertinent to the Company when planning to
enter a new-product market. Having as yet no investment in suppliers,
processes, handling & storage, distributors, or final markets, they are in
a position to consider all of them as variables in designing its
physical-distribution system.
Final markets are generally the best starting point for planning the new
system. The company selects its final target markets and then works backward to
an appropriate set of distributors, handling and process locations.
In most instances the industry must adopt a Narrow
View of physical distribution which recognizes that the company is already
established in the marketplace and has commitments to a set of processes,
suppliers, distributors and final markets.
The company's problem is to find efficient arrangements for locating, stocking
and handling its products to meet the service requirements of the marketplace.
This is the point of view taken in this manual.
A useful conception of the component activities of the physical distribution
can be seen as a flow-chart (above). Ten different activity blocks
make up the physical-distribution system.
The whole system centers on the inventory-management block.
Inventory is the link between the customers' orders and the company's process
activity. Customers' orders draw down the product supply, and the process
builds it up.
Process activity requires an inflow of raw materials into the company, and this
involves inbound freight and receiving operations.
Finished products then flow off the process line, involving packaging, in-house
storage, handling activities, outbound transportation, field warehousing, and
customer delivery and service.
|
|
|

H68 Grid Definition![]()
PHYSICAL DISTRIBUTION OBJECTIVES
The industry will state their physical distribution objective as getting the
right goods to the right places at the right time for the least cost.
Unfortunately, this provides little actual guidance.
No physical distribution system can simultaneously maximize customer service
and minimize distribution cost. Maximum customer service implies such policies
as large product availability, premium transportation and handling, and many
location points, all of which raise distribution cost. Minimum distribution cost
implies such policies as slow, cheap transportation and handling, limited
product availability and few location points.
The physical-distribution objective can be defined more carefully by
introducing the notion of an efficient system.
System efficiency is a matter of the ratio of a system's output to its input.
By clarifying what the outputs and inputs are in a physical-distribution
system, one can come closer to defining a clear objective for such a system.
1. Level of Service
A basic output of a physical distribution system is the level of customer
service. Customer service represents one of the key competitive benefits that a
company can offer potential customers in order to attract their business.
From the customer's view, customer service
takes several forms :
1. The speed of filling and delivering
normal orders
2. The supplier's willingness to meet emergency product needs of the customer
3. The care with which products are delivered
4. The supplier's readiness to rectify
complaints
5. The availability of after-sales services
6. The number of options on order handling
7. The supplier's willingness to improve
product availability
8. The additional charges, or prices, policy
From the company’s point of view, they set certain service-level goals.
The service level should set minimum standards and time limits, for order
delivery - or at least - define the level of service as the "percentage of
customers who should get their orders processed in x days". Companies thinking
in terms of a system that holds down backorders to a certain level will not
survive in the long-term.
How can the industry determine a desirable level of customer service?
In many cases one uses the standard set by competitors. If the company offers a
lower level of service than the prevailing one, it is in danger of losing
patronage unless there is some compensatory element in its marketing mix. If
the company offers a higher level of service than the prevailing one, the
competitors may increase their service level in self-defence, and all companies
would be stuck with higher costs. Any advantage will be temporary, especially
if it is an effective advantage.
The company decision on the service level must rest ultimately on an analysis
of probable customer and competitor response to alternative levels of service.
Sometimes a slight increase in customer service can produce a good gain in
customer patronage - say 5-15 percent, whereas a major costly increase may
produce only a slightly higher gain - say 10-20 percent. The value customers
place on service is admittedly one of the hardest things to evaluate in
marketing. Nevertheless, it can sometimes be measured with a little ingenuity.
For example, one might try to correlate the levels of customer complaints with
the length of delay in order processing.
Even where the estimates are rough, one can use sensitivity analysis to find
out how much difference any estimate would make in the choice between
physical-distribution alternatives.
DISTRIBUTION & MARKETING COSTS
F_H - FIN_MKTG.HTM HISTORIC MARKETING DATA
FIN_DEFI.HTM![]() FINANCIAL
DEFINITIONS
FINANCIAL
DEFINITIONS
Base Forecast: Median Market Scenario
F0M |
MEDIAN FORECAST : Financials
|
MEDIAN FORECAST : Financials
G0M|
MEDIAN FORECAST : Margins & Ratios
2. Cost of service
The industry bears certain costs, of which transport, product availability and
handling are the main ones, in providing its present level of customer service.
Often the total bill is not known because the company may typically lack
centralized management and accounting of their physical distribution
activities. These costs, however, must be measured as a prerequisite for
distribution planning and control.
The present system can be said to be efficient if no reorganization of
logistical inputs could reduce the costs while maintaining the present service
level.
The industry may think their physical-distribution system is efficient because
each decision centre - product availability, handling, and traffic - appears to
do a good job of keeping down its own costs. However, this is an area where the
sum of distributional costs is not necessarily minimized by a set of
un-coordinated efforts to minimize the separate costs.
It may well be that pressures are applied by top management which encourage the
separate functional units to control and reduce their costs of operation. Cost
reduction becomes the primary way for these functional units to call attention
to themselves and as a result, when decisions are made about handling, storage,
packaging, product availability levels, et cetera, they are based on an
analysis of alternatives within that specific function, without regard for the
possible effects upon other closely related functions.
Functional costs are considered, but the all-important total cost of the
related functions is ignored.
Various physical distribution costs interact, often in an inverse way:
A functional manager might favor one method of transport over another
because this reduces that department's transport bill; however, because cheaper
methods of transport are usually slower and less reliable, this ties up company
capital longer, delays customer payment, and may cause customers to buy from
competitors offering more rapid service.
Similarly a decision to use cheap packaging to minimize supplies costs will
lead to a high damage rate of products in transit, the perception of a lesser
quality product and thus the loss of customer goodwill.
The importance of these points are that since physical distribution activities
are highly interrelated, decisions must be made on a total system basis.
3. Service objective
One can now define the objective of physical distribution design.
A physical-distribution system consists of a set of decisions on the number,
location, and size of handling facilities; transport policies; and product
availability policies.
Each possible physical distribution system implies a total distribution cost,
as given by the expression :
D = T + FW + VW + S
where,
D = total
distribution costs
T =
total transport costs
FW =
total fixed handling costs
VW =
total variable handling costs
S =
total cost of lost sales due to average delivery delay
The choice of a physical distribution system calls for examining the total
distribution cost associated with different proposed systems and selecting the
system that minimizes total distribution cost.
|
|
|
H69
|
|
|
H70 Grid Definition![]()
ALTERNATIVES IN PHYSICAL DISTRIBUTION
The industry face a large number of alternatives in the designing or
redesigning of its physical distribution system. The variety increases in
number and complexity as one goes from an operation with a single process
location serving a single market to an operation with multiple process
locations and multiple markets.
1. Single Location, Single Market
The vast majority of companies are single location firms doing business in
single markets. The single markets served may be a small city, as in the case of
small service firms, or a region, as in the case of local suppliers of
consumable products.
Does the single location firm generally locate in the midst of its market?
It often does, for the cost of serving a market increases with the distance.
The distant firm has to absorb higher customer handling costs and is normally
at a competitive disadvantage.
Yet in some cases there are offsetting economies in locating a plant at some
distance from the market. The higher market customer handling cost may be
offset by lower costs of property, labor, energy, or supplies.
The merits of locating process facilities near the market or near its sources
depend mainly on relative transfer or processing costs. A substantial change in
certain costs could upset the balance of advantages. The firm choosing between
two alternative process sites must carefully weigh not only present alternative
costs but forecast alternative costs.
2. Single Location, Multiple Markets
An operation having a single process location and selling in a dispersed set of
markets has a choice of several physical distribution strategies.
In this scenario there are at least four alternatives:
i. Direct Handling of customers
ii. Bulk Handling of customers via a local handling facility
iii. Part processing at a local or remote location
iv. Full processing at a local or remote location.
i. Direct handling of customers
Any proposed system of physical distribution must be evaluated in terms of
customer service and cost. The direct handling scenario leaves the impression
that it would score poorly on both of these counts. In the first place, direct
handling would seem to imply a slower service than the handling of the customer
from a local facility. Further, direct handling would seem to imply more cost
because the typical customer order may be relatively small.
Whether direct handling does involve these disadvantages depends upon a number
of things. It is conceivable that direct handling from a distant process
location could effect faster delivery than handling from a nearby service
location. Furthermore, direct handling of small value orders must be measured
against the cost of maintaining local or remote locations. The decision on
whether to use direct handling depends on such factors as the nature of the
product (its unit value, perishability and seasonality), the required speed
& cost of delivery, the physical characteristics of the typical customer
order, the physical distance and direction.
This analysis is incomplete because each handling alternative implies a
different average delivery time and one can assume a higher cost of lost sales
for longer delivery delays. Thus the slower modes of customer handling cost
less - but adversely effect sales revenue.
These two diverging cost functions of delivery time are shown below:
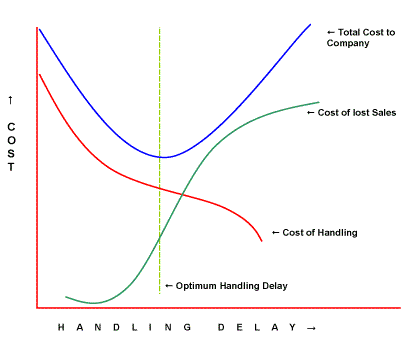
By adding the two cost curves vertically, we can find a total-cost curve. The total-cost curve tends to be
U-shaped, and by projecting its minimum point down to the Handling Delay axis, we can estimate the optimum
handling delay. This delay has the property that the marginal savings in costs
from a slightly longer delay would just equal the marginal cost of lost
patronage.
ii. Bulk handling of customers from a local handling facility
The company may find it less expensive to do bulk handling of customers via a
local handling facility.
The savings would arise mainly because of the substantial difference between
bulk handling costs and small value order costs. From this, one has to subtract
the cost of local customer handling from the location to the customer and the
cost of premises.
To this possible handling savings should be added another advantage accruing
from the use of a market-located customer handling point which is likely to
increase the attractiveness of the product and thereby increase customer
patronage. In general, the optimizing rule for adding regional locations is simple
enough. A regional location should be added if the handling savings and
increased patronage resulting from faster delivery exceed the incremental costs
of operating the warehouse.
But an extensive regional system raises a number of new problems:
What is the best number of points? Where should they be located?
What is the best level of service to supply at each ?
Paper-and-pencil analysis is exceedingly inadequate to answer these questions
and thus one needs to turn to computer models.
iii. Part processing at a local or remote location
A third alternative is to establish a process location near the market. The
presence of a regional plant also stimulates the increased interest of local
distribution channels and the community at large.
Against this the company must consider the fixed investment cost in additional
facilities.
iv. Full processing at a local or remote location
The decision to acquire a regional process facility requires the most detailed
factual information and analysis of the local scene.
Many factors are involved, including the availability and costs of manpower,
energy, land, transportation and, not the least important, the legal and
political environment.
One of the most important factors is the nature of economies of scale . In
operations requiring a relatively heavy fixed investment, a location has to be
quite large in order to achieve cost economies. If the unit costs of process
decrease continuously with the scale of plant, then one plant could logically
supply the entire company volume at minimum process costs; however, it would be
fallacious to ignore distribution costs, because they tend to be higher at
higher volumes.
3. Multiple Locations, Multiple Markets
Many of the large operations that do not require extremely large processes to
achieve economies of scale utilize a physical distribution system consisting of
many process locations and many handling points.
These companies face two optimization tasks:
i. The first is to set a process-to-point of sale shipping pattern that
minimizes total handling costs, given the present process and handling
locations.
ii. The second is to determine the number and location of facilities that will
minimize total distribution costs.
Here system simulation is a potent technique.
The physical distribution system must be designed not for maximum economy for
the present so much as maximum flexibility for the future, even if present
costs must be a little higher in order to gain this flexibility. The company's
plans for entering new product markets, for introducing new product revisions,
and for changing the number of distributors should all count in designing the
system.
The system should be planned with an awareness of environmental developments,
particularly in the areas of communications, transportation, and automation.
Such innovations as automated handling, joint venture transportation,
electronic hookups between computers in different locations, containerization,
and rapid handling are all factors to consider.
|
|
|
H71 Grid Definition![]()
PRODUCT AVAILABILITY DECISIONS
While a company’s marketing management generally does not have control
over product availability policy, it is inclined to seek a strong voice in the
making of product supply policy. The marketing management’s chief concern
lies in providing a high level of service for his customers. Product supply
policy is viewed by him as an instrument in the demand creation and demand
satisfaction process.
However, it is not realistic from a cost point of view for a company to
increase product availability to a level that would guarantee complete supply
to all customers. A major reason is that product supply cost increases at an
increasing rate as the customer service level approaches 100 percent.
The acceleration of product supply cost does not mean that increases in
customer service are never warranted. Increases in service, results in increases
in patronage and sales. One needs to know whether sales and profits will
increase enough to justify the higher investment.
1. Types of Product Supply & Availability decisions
Product Supply & Availability decision making can be thought of as a two-step
decision process:
i. Supply Timing
ii. Supply Quantity
i. Supply Timing
The basic characteristic of Product Supply is
that it is consumed over time.
This calls for a determination of the level at which the remaining product
availability justifies the placement of product supply capacity.
The determination of the product supply capacity replacement point depends upon
the process lead time, the usage rate and the service standard.
The higher the process lead time, the customer usage rate and the company
service standard, the higher the replacement point.
Furthermore, if the process lead time and customer usage rate are variable, the
replacement point would have to be higher by a safety margin. The final order
point is set on the basis of balancing the risks of being unable to supply
against the costs of oversupply.
ii. Supply Quantity
The decision the company makes on Supply Quantity directly influences Supply
Timing. The larger the Supply Quantity, the less (usually) the Supply Timing.
Order processing costs are somewhat
different for the distributor and the supplier. The distributor's processing
costs consist of whatever materials, computer time and labor are used up every
time an order is placed, received and checked.
Order processing costs for a supplier consist of setup costs and running costs
for the product. If setup costs are very low, the supplier can process the
product often and the cost per order is pretty constant and equal to the
running costs. However, if setup costs are high, the supplier can reduce the
average cost per unit order by producing a long process run and carrying more
supply availability.
Order processing costs must be compared with the costs of maintaining the
Supply Quantity, called carrying costs. The
larger the average product availability carried, the higher the supply carrying
costs. These carrying costs fall into four major categories:
a. Handling and Storage charges
b. Cost of capital
c. Taxes and insurance
d. Depreciation and obsolescence
Carrying costs may run as high as 25% of the product value. This may be higher
than the estimate used by many managers, but there is growing recognition that
the cost is very high. This means that managers who want their companies to
carry larger product availability must be able to convince top management that
the higher product supply will yield new sales with an incremental gross profit
that would more than cover the incremental carrying costs.
The optimal supply quantity can be
determined by observing how order processing costs and carrying costs sum up at
different possible order levels.
Order processing costs per product unit can be shown to fall with the number of
units ordered, as the order costs are spread over more units. Carrying charges
per unit are shown to rise with the product units ordered, because each unit
remains longer unsold.
LOCATION DECISIONS
Marketing management in the industry has a keen interest in location decisions
made by the firm. Point of Sale outlets must be carefully located near the
greatest number of potential customers, because of the importance of
convenience. Even handling locations should be located near the customer
concentration points to ensure faster and cheaper delivery to customers.
1. Types of Location Decisions
Location decision making can be thought of as two-step decision process:
i. Selecting a general area
ii. Selecting a specific site
i. Selecting the area
It is usually a distribution management responsibility to identify and evaluate
the profit potential of various areas in each of the countries in which the
company operates. The areas might be cities, standard metropolitan areas, or
some other geographical unit.
Suppose a set of n
areas (1,2,3,..., i, ...., n) is to be evaluated.
Let Z i represent the
expected profit potential of the i th area.
Let X i be
a proposed company investment in developing area i.
The expected profit potential will vary with development expenses. That
is, Zi
= f(Xi )
A larger outlet, a better distributor, or a larger promotion budget invested in
a particular area would create higher profits, although the rate of profit
increase can be expected to diminish beyond some level investment.
The company has the task to estimate, for each candidate area, how profits
would behave at different levels of investment. Once it derives a set of area
profit functions, it can allocate its total "new locations" budget to
these areas in such a way that the marginal profits is the same in all areas.
Although the area investment problem turns out to be simple to solve in
principle, everything hinges on being able to estimate expected profits as a function
of investment:
Zi = f(Xi ) |
Area profits are a
complex function of area cost and area characteristics. The relevant cost
characteristics of an area, such as premises costs and advertising rates, are
fairly easy to determine. It is the area's demand potential that is usually
hard to determine.
One can initially
identify several hundred variables that could influence area sales. On closer
examination of the logical rationale for each variable, one is able to reduce
the set to perhaps fifty.
One needs to use
such a formula for both existing locations as well as proposed new locations.
ii. Selecting the
site
After determining
the areas of high potential, the firm must decide how many outlets to maintain
and/or establish and where they should be specifically situated. If one city or
region appears to be a high-potential market, the firm could establish, for
about the same investment one large outlet in a central location or a few
smaller outlets in separate parts of the city. The perception of the customer
about the relative positioning of the
product or service will affect consumer behavior; for example if customers
believed the product to be a specialty, they would be willing to travel longer
distances, and this would favor one large, centrally located location. If
customers regarded products as convenience products or services, this would
favor establishing a few smaller outlets.
A location’s
trading area or reach is affected by a number of
other factors besides the type of product. One is the number of different
products or services carried by the location.
One model develops
an analysis in which one can visualize each consumer as calculating his net
gain from patronizing a location with N items at a distance D.
One assumed that
increases in N more than compensated for increases in D up to a point.
Beyond this point,
the cost of traveling to the location became dominant.
The utility
expected by a customer in location i of buying at an outlet in location j is
affected by many variables in addition to N and D.
Included are such
factors as image, delivery, credit, service policies, promotion, parking
facilities, et cetera. If consumer utility as a function of these variables
could be measured, the choice of the best site and outlet size from a list of
alternatives is solvable in principle.
Suppose there are
three alternative proposed sites - 1, 2, and 3 - offering utilities
40, 30, and
10, respectively, to a customer in location
i.
The probability
that this customer would buy at site 1 is the ration of the utility of site
1
to the total utility, in this case .50 ( = 40/80).
If there are 1,000 similar customers clustered at location
i, then half
of them, or 500, can be expected to patronize proposed site 1.
In a more advanced analysis, it would be desirable to distinguish major
socioeconomic types or buyer profiles of customers at location
i,
because there are strong interaction of customer type and outlet type.
In practice, firms vary considerably in how analytically they investigate the
trade potential of proposed sites. Small firms rely on basic customer data and
on simple traffic counts. Large firms carry out expensive surveys of customer
buying habits and make extensive calculations of expected sales volume.
The expanding firm often develops explicit criteria to guide its search for
sites and cut down its search time.
For example typical criteria for the location
of sites may include:
a. Annual sales volume target per location
b. Site and support infrastructure
c. Demographic data
d. Customer profiles and growth prospects
e. Geographic siting in relation to company's other sites
f. Ownership and terms of location
g. Trading area data and growth prospects
While these heuristic principles may lead the company to overlook a very good
site, they save the company the expense of considering a great number of
potentially poor sites.
In undertaking a detailed commercial analysis for a proposed site, the firm
must first prepare area maps indicating density and the location of competitive
intercepting facilities. An overlay on this map indicates major arteries to
pinpoint traffic flows.
One can then determine the availability and cost of potential sites within the
general area. The trade potential of each site is then evaluated. A series of
circles is drawn around each site at varying distances to indicate the primary
trading area, the secondary trading area, and the fringe trading area. The
secondary and fringe areas are further away from the new site and closer to
competitive sites; they can be expected to contribute a progressively smaller
amount of per capita sales. - Use can be made of a formula which supplies a
means for estimating the sales volume drawn by competing sites as a function of
location size and customer access and time taken.
Ba |
|
P1a |
D2b |
= |
|||
Bb |
|
Pb |
Da |
where,
Bi = the proportion of trade from the immediate town attracted by city i
Pi = the population of city i
Di = the distance from the intermediate town to city i
a, b = the particular cities being compared
One may develop and utilize elaborate site location checklists in their evaluation
of sites. The checklist would contain factors, each of which has to be rated
excellent, good, fair, or poor in evaluating a proposed site. These factors
relate to the site's trading area potential
accessibility, growth potential, competitive interception and site economics.
DISTRIBUTION RESPONSIBILITY
1. Divided Authority
It should be abundantly clear that decisions on transport, handling, product
availability and location require the highest degree of co-ordination. Yet it may
be the case that in a company’s, physical distribution responsibilities
tend to be divided in an ill-coordinated and often arbitrary way among several
company departments. Furthermore, each department tends to adopt a narrow view
of the company's physical distribution objective.
One manager may seek to minimize one departmental bill at the cost of another
department. One operational unit may adopt physical distribution objectives and
policies which will disadvantage other units up-stream or down-stream. Each
operational manager jealously guards his prerogatives and this inevitably
results in system sub-optimization.
2. Organizational Alternatives
Companies are increasingly recognizing the potential benefits of developing
some coordinating mechanism and have generally chosen one of two forms;
firstly, the establishment of a team composed of personnel responsible for
different physical distribution activities, that meets periodically to work out
policies for increasing the efficiency of the overall distribution system; or
secondly, the centralization of their physical distribution activities in the
hands of a single department or manager.
When a company establishes a separate department with responsibility for
physical distribution, the major issue is whether the new department should
have separate status or be placed within one of the major existing departments.
For example, a company might create a new department of co-ordinate stature
with Marketing and Production which was headed by a Director of Distribution;
thereby hoping that this arrangement would guarantee respect for the
department, develop a greater degree of professionalism and objectivity, and
avoid partisan domination by Marketing or Production.
On the other hand, a company may place its new Distribution Service Department
within the Marketing Department. By this move, expressing the great importance
it attached to good customer service relative to the costs of providing it.
Wherever marketing is the crucial factor in competitive success, physical
distribution is usually placed under the marketing department. This is
especially true in very competitive markets where marketing and physical
distribution must be coordinated not only to minimize costs but also to
harmonies with frequent advertising campaigns and customer and distributor
promotions.
The location of the department, or even its creation, is a secondary concern.
The important thing is the recognition by the company that if it does not
co-ordinate the planning and operation of its physical distribution activities,
it is missing the opportunity for often sizable cost savings and service
improvements. When this fundamental awareness takes place, each company can
then make a determination of what would constitute the most appropriate
coordinative mechanism.
|
|
|
H72 Grid Definition![]()
DISTRIBUTION CHANNEL INVESTMENT EFFECT FORECASTS
This section analyses the effects of a Distribution Channel Improvement programme
and its inferred expenditure in terms of the industry's Financial and
Operational results.
Distribution Channel Investments can bring almost immediate results in terms of
turnover and profitability and in general terms the investment involves both
short-term tactical projects as well as medium-term expenditure on equipment
and capital projects.
The Financial and Operational Distribution Channel Investment Scenario Data
forecasts given make the following assumptions:-
1. Forecasts are based on all external factors:
a. Market Growth (Medium + Long Term)
b. Competitive Market Factors
c. Competitor + Industry Environment Factors
2. Forecasts assume ceteris paribus in terms of internal factors with
the exception of a Distribution Channel Improvement programme and its
expenditure which is assumed to increase by a rate equivalent to 5% greater
than the competitor average
3. Forecasts assume changes in Market Competitors. The forecast assumptions use
Competitor databases to forecast changes in competitive situations which will
affect the Company and includes the Competitor response (in Distribution
Channel Terms) to the scenario shown.
Distribution Channel Improvement Scenario
F06|
DISTRIBUTION CHANNEL IMPROVEMENT : Financials
G06|
DISTRIBUTION CHANNEL IMPROVEMENT : Margins & Ratios
HISTORIC FINANCIAL DATA
PHYSICAL DISTRIBUTION + CUSTOMER HANDLING FINANCIAL ISSUES
F_H
- FIN_HIST.HTM
HISTORIC FINANCIAL DATA
PHYSICAL DISTRIBUTION + CUSTOMER HANDLING FINANCIAL SCENARIOS
FINANCIAL DATA FORECAST
PHYSICAL DISTRIBUTION + CUSTOMER HANDLING FINANCIAL SCENARIOS BASED BALANCE SHEET FORECASTS
The PHYSICAL DISTRIBUTION + CUSTOMER HANDLING FINANCIAL SCENARIOS BALANCE SHEET
FORECASTS section gives a series of Balance Sheet Forecasts for the industry
using a number of assumptions relating to the distribution and customer
handling decisions available to the management of the industry.
The Balance sheet forecast given shows the effects of distribution and customer
handling improvements which Management is likely to recommend:
PHYSICAL DISTRIBUTION + CUSTOMER HANDLING FINANCIAL SCENARIOS
- Fixed Marketing Cost Objectives
- Distribution & Product Delivery Cost Objectives
- Order Taking Improvements
- Customer / Order Processing Systems Investment
- Systems Investment
- Profit Impact From Distribution Cost Reduction
- Profit Impact From Customer Handling Cost Reduction
- Capital Investments Options: Distribution / Handling
- Capital Investments Options: Customer Handling Systems
- Customer Handling Improvements
Managers in the industry will, in both the short-term and the long-term, have
vital decisions to make regarding the distribution and customer handling
improvements, margins and profitability and these decisions will need to be
evaluated in light of the customers, markets, competitors, products, industry
and internal factors. The scenarios given isolate a number of the most
important factors and provide balance sheet forecasts for each of the scenarios.
The data provides a short and medium term forecast covering the next 6 years
for each of the Forecast Financial and Operational items. The Financial and
Operational Data sections show each of the items listed below in terms of
forecast data and covers a period of the next 6 years.
Fixed Marketing Cost Objectives
F25|
FIXED MARKETING COST OBJECTIVES : Financials
G25|
FIXED MARKETING COST OBJECTIVES : Margins & Ratios
Distribution & Product Delivery Cost Objectives
F28|
DISTRIBUTION & PRODUCT DELIVERY COST OBJECTIVES : Financials
G28|
DISTRIBUTION & PRODUCT DELIVERY COST OBJECTIVES : Margins &
Ratios
Order Taking Improvements
F42|
ORDER TAKING IMPROVEMENTS : Financials
G42|
ORDER TAKING IMPROVEMENTS : Margins & Ratios
Customer / Order Processing Systems Investment
F45|
CUSTOMER / ORDER PROCESSING SYSTEMS INVESTMENT : Financials
G45|
CUSTOMER / ORDER PROCESSING SYSTEMS INVESTMENT : Margins & Ratios
Systems Investment
F46|
SYSTEMS INVESTMENT : Financials
G46|
SYSTEMS INVESTMENT : Margins & Ratios
Profit Impact From Distribution Cost Reduction
F64|
PROFIT IMPACT FROM DISTRIBUTION COST REDUCTION : Financials
G64|
PROFIT IMPACT FROM DISTRIBUTION COST REDUCTION : Margins & Ratios
Profit Impact From Customer Handling Cost Reduction
F65|
PROFIT IMPACT FROM CUSTOMER HANDLING COST REDUCTION : Financials
G65|
PROFIT IMPACT FROM CUSTOMER HANDLING COST REDUCTION : Margins & Ratios
Capital Investments Options: Distribution / Handling
F68|
CAPITAL INVESTMENTS OPTIONS: DISTRIBUTION / HANDLING : Financials
G68|
CAPITAL INVESTMENTS OPTIONS: DISTRIBUTION / HANDLING : Margins & Ratios
Capital Investments Options: Customer Handling Systems
F69|
CAPITAL INVESTMENTS OPTIONS: CUSTOMER HANDLING SYSTEMS : Financials
G69|
CAPITAL INVESTMENTS OPTIONS: CUSTOMER HANDLING SYSTEMS : Margins & Ratios
Customer Handling Improvements
F72|
CUSTOMER HANDLING IMPROVEMENTS : Financials
G72|
CUSTOMER HANDLING IMPROVEMENTS : Margins & Ratios
FIN_DEFI.HTM![]() Financial Definitions
Financial Definitions
INDEX
Additional charges, 7
ADVERTISING COSTS, 8
ADVERTISING COSTS FORECAST, 10
After-sales, 7
AFTER-SALES COSTS, 8
AFTER-SALES COSTS FORECAST, 10
ALTERNATIVES IN PHYSICAL DISTRIBUTION, 21
Balance Sheet Capital Investments Options: Customer Handling, 80
Balance Sheet Capital Investments Options: Distribution, 76
Balance Sheet Customer Handling Improvements, 84
Balance Sheet Customer / Order Processing Systems, 60
Balance Sheet Distribution Channel Improvement Scenario, 36
Balance Sheet Distribution & Product Delivery Costs, 52
Balance Sheet Fixed Marketing Cost Objectives, 48
Balance Sheet Historic, 42
Balance Sheet Order Taking Improvements, 56
Balance Sheet Profit Impact From Customer Handling, 72
Balance Sheet Profit Impact From Distribution Costs, 68
Balance Sheet Systems Investment, 64
Broad View, 2
Bulk handling - local facility, 22
Care, 7
Carrying costs, 27
Cost of capital, 27
Cost of Handling, 21
Cost of service, 12
Cost of Service: Functional Costs, 13
Cost of Service: Physical Handling Costs, 13
Costs & Margins Historic, 43
Customer service, 7
Delivering normal orders, 7
Depreciation and obsolescence, 27
Direct handling of customers, 21
DISTRIBUTION CHANNEL INVESTMENT EFFECT FORECASTS, 35
DISTRIBUTION COSTS, 17
DISTRIBUTION DECISIONS, 31
DISTRIBUTION EFFICIENCY, 3
Distribution Planning & Accounting, 3
DISTRIBUTION RESPONSIBILITY, 30
DISTRIBUTION SCOPE, 2
Distribution & Storage Fixed Costs, 17
Distribution & Storage Variable Costs, 17
DISTRIBUTION + CUSTOMER HANDLING FINANCIAL FORECASTS, 47
DISTRIBUTION + HANDLING COSTS, 8
DISTRIBUTION + HANDLING COSTS FORECAST, 10
Divided Authority, 30
Emergency product needs, 7
Financial data definitions, 89
Financial forecast notes, 40, 46
Financial Ratios Capital Investments: Customer Handling, 82
Financial Ratios Capital Investments Options: Distribution, 78
Financial Ratios Customer Handling Improvements, 86
Financial Ratios Customer / Order Processing System, 62
Financial Ratios Distribution Channel Improvement, 38
Financial Ratios Distribution & Product Delivery Costs, 54
Financial Ratios Fixed Marketing Cost Objectives, 50
Financial Ratios Order Taking Improvements, 58
Financial Ratios Profit Impact From Customer Handling, 74
Financial Ratios Profit Impact From Distribution Costs, 70
Financial Ratios Systems Investment, 66
Financial Ratios & Margins Historic, 44
Full processing -local or remote, 22
Handling and Storage charges, 27
Handling Delay, 21
HISTORIC FINANCIAL DATA, 41
HISTORIC MARKETING COST RATIOS & MARGINS, 9
HISTORIC MARKETING COSTS & MARGINS, 8
Improve product availability, 7
Level of Service, 7
Level of Service: Problem Solving, 13
Level of Service: Product / Price / Service Factor, 13
Level of Service: Responsiveness, 13
LEVEL + COST OF SERVICE, 13
LOCATION DECISIONS, 28
Location of sites, 29
Locations Efficiency, 31
MARKETING COSTS, 9
MARKETING COSTS FORECAST, 10
MARKETING FACTORS FORECAST, 11
MARKETING MARGINS + RATIOS FORECAST, 11
MARKETING OPERATIONAL RATIOS, 9
MARKETING OPERATIONAL RATIOS FORECAST, 11
MARKETING RATIO, 9
MARKETING RATIOS FORECAST, 11
Multiple Location / Multiple Markets, 23
Multiple Locations -Multiple Markets, 22
Narrow View, 2
Operational Costs Capital Investments: Customer Handling, 81
Operational Costs Capital Investments: Distribution, 77
Operational Costs Customer Handling Improvements, 85
Operational Costs Customer / Order Processing Systems, 61
Operational Costs Distribution Channel Improvement, 37
Operational Costs Distribution & Product Delivery, 53
Operational Costs Fixed Marketing Cost Objectives, 49
Operational Costs Order Taking Improvements, 57
Operational Costs Profit Impact: Customer Handling Improvement, 73
Operational Costs Profit Impact: Distribution Improvement, 69
Operational Costs Systems Investment, 65
Operational Margins Capital Investments: Customers, 83
Operational Margins Capital Investments: Distribution, 79
Operational Margins Customer Handling Improvements, 87
Operational Margins Customer / Order Processing Systems, 63
Operational Margins Distribution Channel Improvements, 39
Operational Margins Distribution & Product Delivery, 55
Operational Margins Fixed Marketing Cost Objectives, 51
Operational Margins Order Taking Improvements, 59
Operational Margins Profit Impact From Customer Handling, 75
Operational Margins Profit Impact From Distribution, 71
Operational Margins Systems Investment, 67
Operational Ratios & Margins Historic, 45
Optimal supply quantity, 27
Optimum Handling Delay, 21
Options, 7
Order Handling & Processing, 3
Order processing costs, 27
Organizational Alternatives, 30
Organizational Efficiency, 31
Organizational & Decision Flexibility, 31
Part processing - local or remote, 22
PHYSICAL DISTRIBUTION, 23
Physical Distribution Efficiency, 3
PHYSICAL DISTRIBUTION OBJECTIVES, 7
PHYSICAL DISTRIBUTION SYSTEM FLOW CHART, 2
PHYSICAL DISTRIBUTION + CUSTOMER HANDLING, 1
Physical Handling & Process Fixed Costs, 17
Physical Handling & Process Variable Costs, 17
Point of Sale & Customer Service Efficiency, 3
Potential accessibility, 29
Process Management & Handling, 3
PRODUCT AVAILABILITY DECISIONS, 27
Product Availability Quantity Efficiency, 31
Product Availability Timing Efficiency, 31
Product Supply, 27
Product Supply & Availability, 27
PROFIT RATIOS, 9
PROFIT RATIOS FORECAST, 11
Rectify complaints, 7
Relative positioning, 28
SALES COSTS, 8
SALES COSTS FORECAST, 10
Selecting the area, 28
Selecting the site, 28
Service objective, 12
Single Location / Multiple Markets: Bulk Handling, 23
Single Location / Multiple Markets: Direct Handling, 23
Single Location / Multiple Markets: Split Processing, 23
Single Location / Single Markets, 23
Single Location - Multiple Markets, 21
Single Location - Single Market, 21
Site economics, 29
Speed, 7
Supplier's willingness, 7
Supply Quantity, 27
Supply Timing, 27
Taxes and insurance, 27
Total Distribution Costs, 17
TOTAL MARKETING COSTS, 8
TOTAL MARKETING COSTS FORECAST, 10
Total-cost curve, 21
Trading area, 28
Types of Location Decisions, 28
CONTENTS
additional charges
after-sales
ALTERNATIVES IN PHYSICAL
DISTRIBUTION
Base Forecast: Median Market
Scenario
Broad View
Bulk handling - local facility
Capital Investments Options:
Customer Handling Systems
Capital Investments Options:
Distribution / Handling
care
carrying costs
Cost of capital
Cost of Handling
Cost of Service: Functional Costs
Cost of Service: Physical
Handling Costs
Cost of service
customer service
Customer / Order Processing
Systems Investment
Customer Handling Improvements
delivering normal orders
Depreciation and obsolescence
Direct handling of customers
Distribution &
Product Delivery Cost Objectives
Distribution & Storage
Fixed Costs
Distribution & Storage
Variable Costs
DISTRIBUTION + CUSTOMER
HANDLING FINANCIAL FORECASTS
Distribution Channel Improvement
Scenario
DISTRIBUTION CHANNEL
INVESTMENT EFFECT FORECASTS
DISTRIBUTION COSTS
DISTRIBUTION DECISIONS
DISTRIBUTION EFFICIENCY
Distribution Planning &
Accounting
DISTRIBUTION RESPONSIBILITY
DISTRIBUTION SCOPE
Divided Authority
emergency product needs
Fixed Marketing Cost Objectives
Full processing - local or remote
Handling and Storage charges
Handling Delay
HISTORIC FINANCIAL DATA
improve product availability
LEVEL + COST OF SERVICE
Level of Service: Problem Solving
Level of Service: Product /
Price / Service Factors
Level of Service: Responsiveness
Level of Service
LOCATION DECISIONS
location of sites
Locations Efficiency
Multiple Location / Multiple
Markets
Multiple Locations - Multiple
Markets
Narrow View
optimal supply quantity
Optimum Handling Delay
options
Order Handling & Processing
Order processing costs
Order Taking Improvements
Organizational &
Decision Flexibility
Organizational Alternatives
Organizational Efficiency
Part processing - local or remote
PHYSICAL DISTRIBUTION +
CUSTOMER HANDLING
Physical Distribution Efficiency
PHYSICAL DISTRIBUTION OBJECTIVES
PHYSICAL DISTRIBUTION SYSTEM
FLOW CHART
PHYSICAL DISTRIBUTION
Physical Handling &
Process Fixed Costs
Physical Handling &
Process Variable Costs
Point of Sale &
Customer Service Efficiency
potential accessibility
Process Management & Handling
Product Supply
PRODUCT AVAILABILITY DECISIONS
Product Availability
Quantity Efficiency
Product Availability Timing
Efficiency
Product Supply & Availability
Profit Impact From Customer
Handling Cost Reduction
Profit Impact From
Distribution Cost Reduction
rectify complaints
relative
Selecting the area
Selecting the site
Service objective
Single Location - Multiple
Markets
Single Location - Single Market
Single Location / Multiple
Markets: Bulk Handling
Single Location / Multiple
Markets: Direct Handling
Single Location / Multiple Markets:
Split Processing
Single Location / Single Markets
site economics Types of Location Decisions
speed
supplier's willingness
Supply Quantity
Supply Timing
Systems Investment
Taxes and insurance
Total Distribution Costs
total-cost curve
trading area
PHYSICAL DISTRIBUTION +
CUSTOMER HANDLING
PHYSICAL DISTRIBUTION SYSTEM
FLOW CHART
DISTRIBUTION SCOPE
PHYSICAL DISTRIBUTION OBJECTIVES
Level of Service
Cost of service
Service objective
ALTERNATIVES IN PHYSICAL
DISTRIBUTION
Single Location - Single Market
Single Location - Multiple
Markets
Direct handling of customers
Bulk handling - local facility
Part processing - local or remote
Full processing - local or remote
Multiple Locations - Multiple
Markets
PRODUCT AVAILABILITY DECISIONS
Product Supply & Availability
Supply Timing
Supply Quantity
LOCATION DECISIONS
Types of Location Decisions
Selecting the area
Selecting the site
DISTRIBUTION RESPONSIBILITY
Divided Authority
Organizational Alternatives
DISTRIBUTION CHANNEL
INVESTMENT EFFECT FORECASTS
HISTORIC FINANCIAL DATA
DISTRIBUTION + CUSTOMER
HANDLING FINANCIAL FORECASTS
DISTRIBUTION EFFICIENCY
Distribution Planning &
Accounting
Process Management & Handling
Physical Distribution Efficiency
Point of Sale &
Customer Service Efficiency
Order Handling & Processing
Base Forecast: Median Market
Scenario
LEVEL + COST OF SERVICE
Level of Service: Responsiveness
Level of Service: Problem Solving
Level of Service: Product /
Price / Service Factors
Cost of Service: Functional Costs
Cost of Service: Physical
Handling Costs
DISTRIBUTION COSTS
Distribution & Storage
Fixed Costs
Distribution & Storage
Variable Costs
Physical Handling &
Process Fixed Costs
Physical Handling &
Process Variable Costs
Total Distribution Costs
PHYSICAL DISTRIBUTION
Single Location / Single Markets
Single Location / Multiple
Markets: Direct Handling
Single Location / Multiple
Markets: Bulk Handling
Single Location / Multiple
Markets: Split Processing
Multiple Location / Multiple
Markets
DISTRIBUTION DECISIONS
Product Availability Timing
Efficiency
Product Availability Quantity
Efficiency
Locations Efficiency
Organizational Efficiency
Organizational &
Decision Flexibility
Distribution Channel
Improvement Scenario
Fixed Marketing Cost Objectives
Distribution &
Product Delivery Cost Objectives
Order Taking Improvements
Customer / Order Processing
Systems Investment
Systems Investment
Profit Impact From
Distribution Cost Reduction
Profit Impact From Customer
Handling Cost Reduction
Capital Investments Options:
Distribution / Handling
Capital Investments Options:
Customer Handling Systems
Customer Handling Improvements