FINANCIAL DATA DEFINITIONS
FINANCIAL DATA DEFINITIONS
NOTES AND DEFINITIONS PLEASE READ BEFORE PROCEEDING
ALL FIGURES IN THIS SECTION ARE IN REAL TERMS
Real Terms are figures excluding the effects of inflation, thus the Forecasts and
figures given can be readily converted into units or volume. This is done
by applying the average prices for the base year and dividing the figures by
this price for all years. Thus, it is possible to easily ascertain
previous and forecasted product volume.
A "most recent published accounts" base is used because most company accounts are historic and thus clients will be able to compare the figures given in this report with their own company figures without the need for conversion or the need for inflators or multiplying factors.
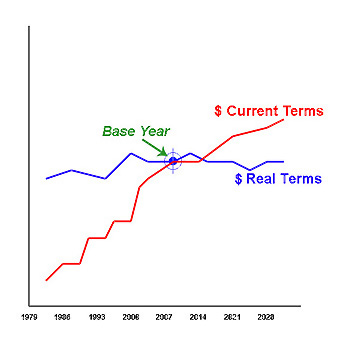 |
The effect of using Real Terms figures is that the forecasted figures will be depressed, as they do not include inflation, and figures from former years (i.e. before the Base Year) will be increased:- In the diagram above a Base Year is represented by the convergence point and the Current Terms by "/". This Current Cost usually increases because of the effects of inflation. The Real Terms figures, "—" , does not include the effects of inflation and thus only increases or decreases if the actual product volume or units increase or decrease. In this way it is possible to evaluate the market and other figures more realistically. |
The figures and the Trend figures represent an overall median probability trend line that is plotted to give the most probable course amongst the annual forecast scatter. Thus, the figures do not reflect year-on-year depressions and peaks in absolute terms, but instead represents a year-on-year modified trend line.
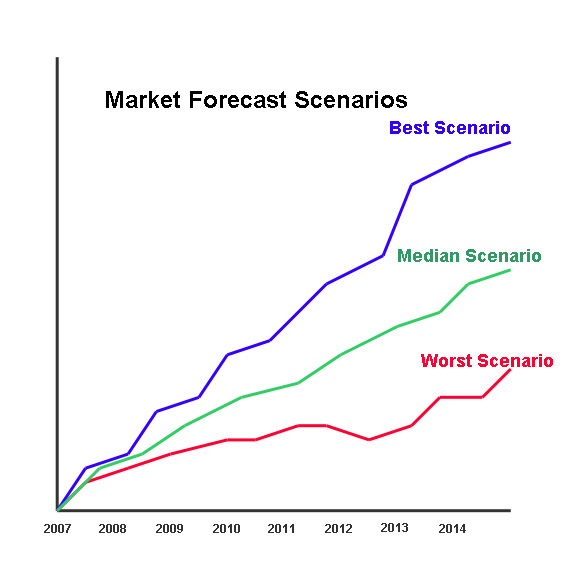 |
The diagram describes the method used to provide a median probability forecast. In any forecasting model there are a number of possible forecast scenarios, these are represented above as "—", "—" and "—", the median probability ("—") plots a curve through the possible forecasts which represent the most probable scenario. This method of forecasting is used in all the forecasts and trends given in this report. |
The U.S. government uses the term Constant dollars (or "real" dollars) and this is defined thus: Output values converted to a base price level, calculated by dividing current (or actual) dollars by a deflator. Use of constant dollars eliminates the effects of price changes between the year of measurement and the base year and allows calculation of real changes in output
CURRENCY DATA: The currency figures given in this report are in U.S. Dollars. If the Windows Regional Settings on your computer is set to a non-U.S. setting then the currency symbol ($) may appear in the local currency (€, £, ¥, etc.). Either reset your Regional settings, or alternatively read all currency figures in this report as being U.S. Dollars (US$).
HISTORIC AND FORECAST FINANCIAL DATA TRANSITION PERIODSThe HISTORIC DATA covers the years from 1997 to Current, and the initial FORECAST DATA series covers the years Current to 2028. There is always a transition period; which is in fact during the last two quarters, i.e. whilst the historic data is being collated. In addition the data given for the next two quarters is considered an estimate rather than a forecast. Thus the 12 month period around the database output date is an estimate. In terms of the various Financial Scenarios it must be assumed that the Scenario factor or strategy being considered will not exert an impact on the forecast immediately and will not become evident for some time after its inception. Whilst the forecasting models used operates on a monthly time scale and does also take account of other temporal factors (for example seasonality of demand, industry accounting periods, stock taking scheduling, et al) it would be too pedantic to express the transition year in greater detail. Therefore in the forecast data a straight line plot is produced between the BASE year (Current), through the transition period (Year +1) to the first forecast year (Year +2). [Users of the more detailed editions of this database will have forecasts on a monthly time series and thus these users will have a monthly, seasonally adjusted plot and not a straight line plot during the transition period.] |